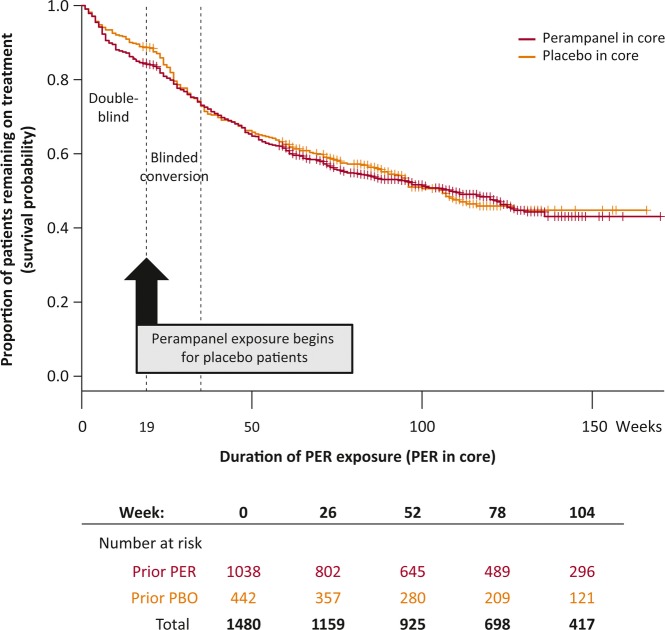
Figure 1.
Kaplan–Meier curve of retention, by previous treatment group in the core studies. Survival probability (patients ongoing as a proportion of the patients at risk [patients at risk determined by study entry and data cutoff]) assessed by previous treatment group. Study time is shown in weeks on the x-axis; exposure to perampanel began at week 0 for patients randomized to perampanel treatment in the core studies, and from week 19 for patients randomized to placebo in the core studies. Patients who did not enter the extension are censored at the end of the 19-week core study (vertical lines), and patients who were ongoing at time of cutoff are also censored (vertical lines, at the corresponding exposure duration they had reached). PER, perampanel; PBO, placebo.

