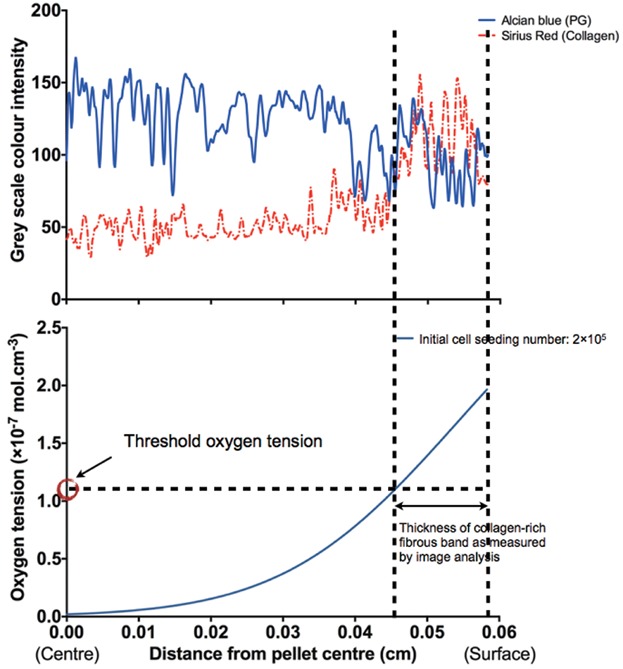
Figure 6.

An example image demonstrating the methodology of determining the threshold oxygen tension. The thickness of fibrous collagenous band measured by ImageJ image analysis, color intensity profile and the O2 tension profile of Day-21 cartilaginous pellets were used for the extrapolation of the threshold oxygen tension. In this example (patient M69, initial cell seeding number = 2 × 10⁵), the average measured radius of pellets was 0.0583 cm. The average fibrous band thickness measured by ImageJ was 0.0115 cm. Therefore, the inner edge of collagen-rich fibrous band, that is, boundary between PG- and collagen-rich matrix, intersected at a distance of 0.0583 − 0.0115 = 0.0468 cm from the centre of the pellet. The threshold oxygen tension was then determined by reading the value of oxygen tension (1.10 × 10⁻⁷ mol cm−3) from the predicted oxygen tension profile at 0.0468 cm in this particular example. Three measurements were performed for each cell seeding number of each patient.
