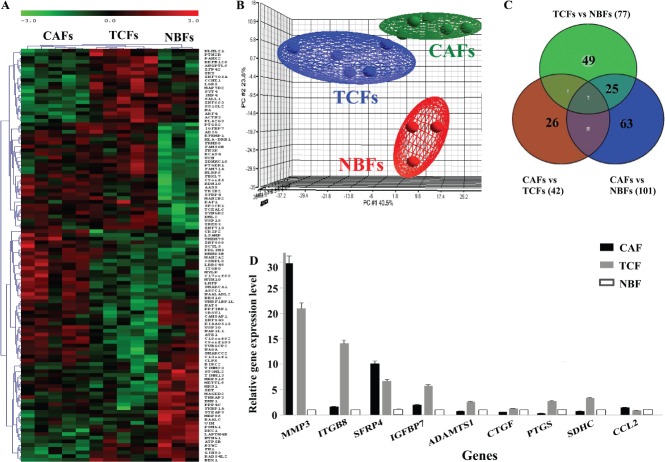
Figure 1.
Differential gene expression between CAFs, TCFs and NBFs. Total RNA from five CAFs, their corresponding TCFs as well as three NBFs was used to perform genome-wide gene expression analysis. (A) Unsupervised 2D hierarchical clustering of significantly varying genes across the three groups was performed using Pearson's correlation with average linkage clustering (only the top 112 of the most significantly dysregulated genes are shown for readability). (B) The three dominant PCA components that contained about 70% of the variance in the data matrix clearly distinguished samples as CAF, TCF and NBF. (C) Venn diagram showing differential gene expression between the groups. (D) qRT–PCR data for the indicated genes (mean ± SD)

