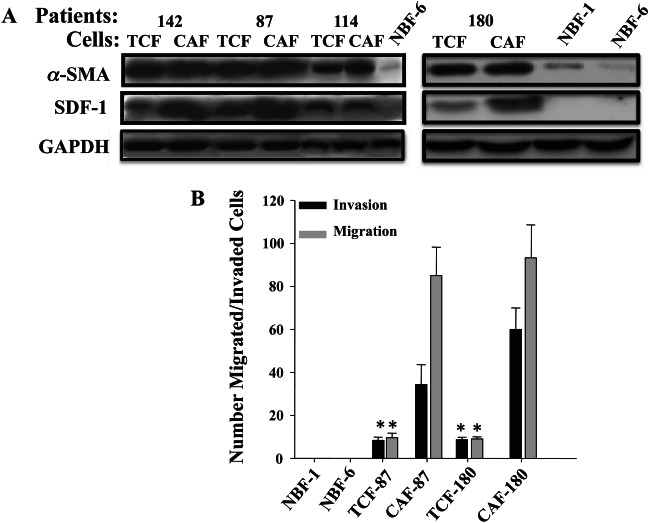
Figure 3.

TCFs are active fibroblasts. (A) Immunoblotting for α-SMA and SDF-1 of the indicated cell lysates. (B) Invasion/migration assays. The numbers of invaded/migrated cells are presented in the histogram (mean ± SD; *p < 0.005 for TCFs compared to NBF-1 and NBF-6; note that CAFs are also significantly different)
