Figure 2.
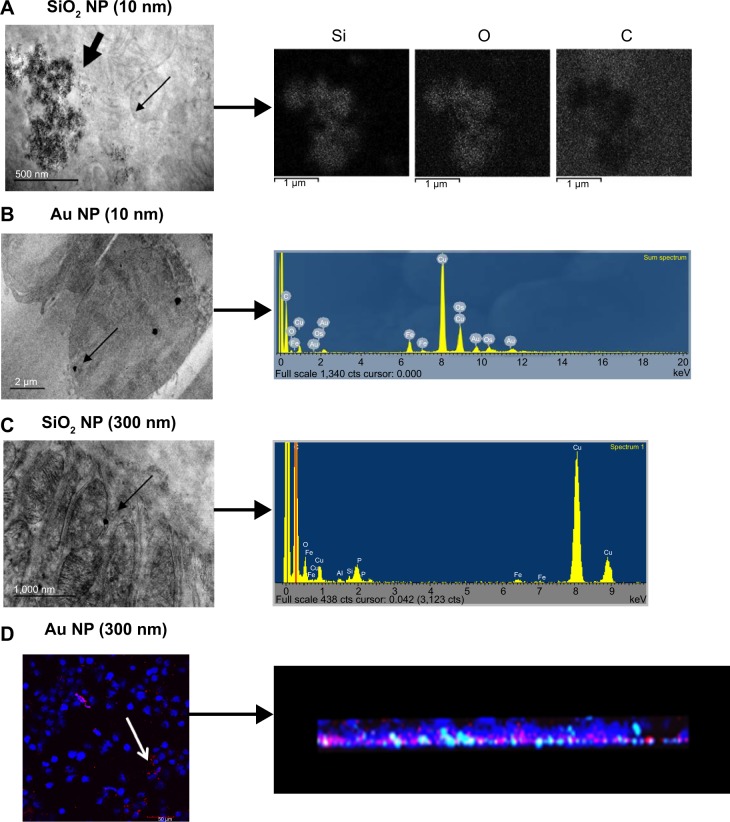
Detection of macrophage incorporation of NPs.
Notes: For A, B, and C, the narrow arrow points out individual NPs within the TEM image. (A) SiO2 NPs (10 nm) with corresponding mapping of elemental Si, O, and C, indicating the presence of the SiO2 NPs. Scale bar =500 nm. NP agglomerates indicated by bold arrow. (B) Au NPs (10 nm) with corresponding EDS spectrum showing the presence of Au. Scale bar =2,000 nm. (C) SiO2 NPs (300 nm) with corresponding EDS spectrum showing the presence of Si. Scale bar =1,000 nm. Note that the TEM images are prepared without traditional post-staining. (D) Au NPs (300 nm) with NP incorporation indicated by confocal microscopy for an entire cell monolayer. White arrow indicates Au NPs within the cell. Corresponding 3D reconstruction indicates NP incorporation within the cell monolayer (brightness/contrast adjusted 60/50, respectively). Scale bar =50 μm. Blue is DAPI-stained nuclei, while red color is reflectance from Au NPs.
Abbreviations: NPs, nanoparticles; EDS, energy dispersive X-ray analysis; TEM, transmission electron microscopy; DAPI, 4′,6-diamidino-2-phenylindole.

