
Figure 2.
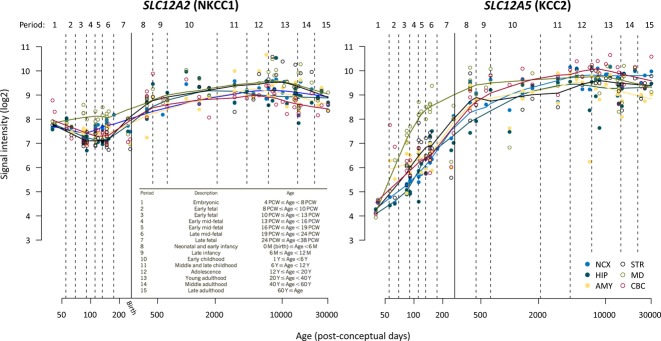
Expression of SLC12A2 (NKCC1) and SLC12A5 (KCC2) transcripts during human brain development. Line plots show the log2-transformed NKCC1 and KCC2 exon array signal intensity from the early fetal period to late adulthood. The solid line with arrow between periods 7 and 8 separates prenatal from postnatal periods. NCX, neocortex; HIP, hippocampus; AMY, amygdala; STR, striatum; MD, mediodorsal nucleus of the thalamus; CBC, cerebellar cortex; PCW, postconceptional week; M, month; Y, year. Data reproduced with permission from http://hbatlas.org; see Kang et al.114