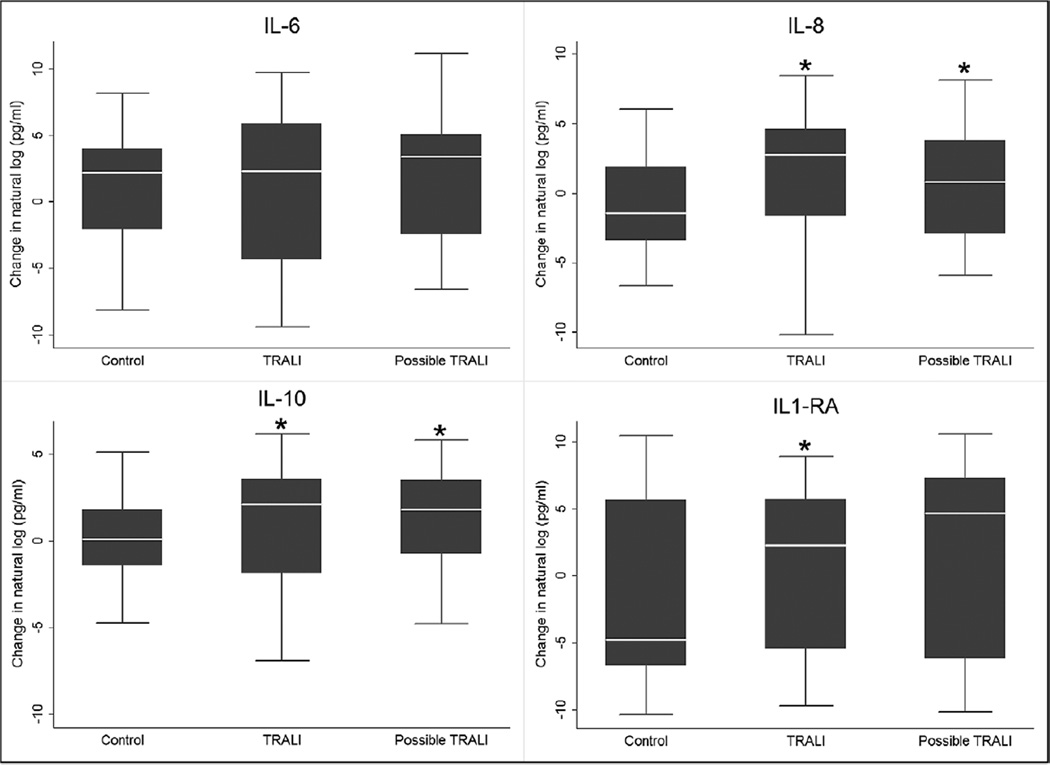
Figure 1.
Systemic inflammatory response in patients with transfusion-related acute lung injury (TRALI) (n = 38) and possible TRALI (n = 57) compared with transfused controls (n = 109). Natural log transformed levels of interleukin (IL)-6, IL-8, IL-10, and IL-1 receptor antagonist (IL-1RA) from paired samples prior to and following transfusion are presented as box-and-whisker plots. The box plot shows the median (horizontal line) and interquartile range (IQR) (25th–75th percentile) (box). The whiskers show the lowest data within 1.5 IQR of the lower quartile and highest data within 1.5 IQR of the upper quartile. Extreme outliers are not shown. Asterisks indicate statistically significant values in TRALI and possible TRALI patients compared with control patients (p < 0.05).

