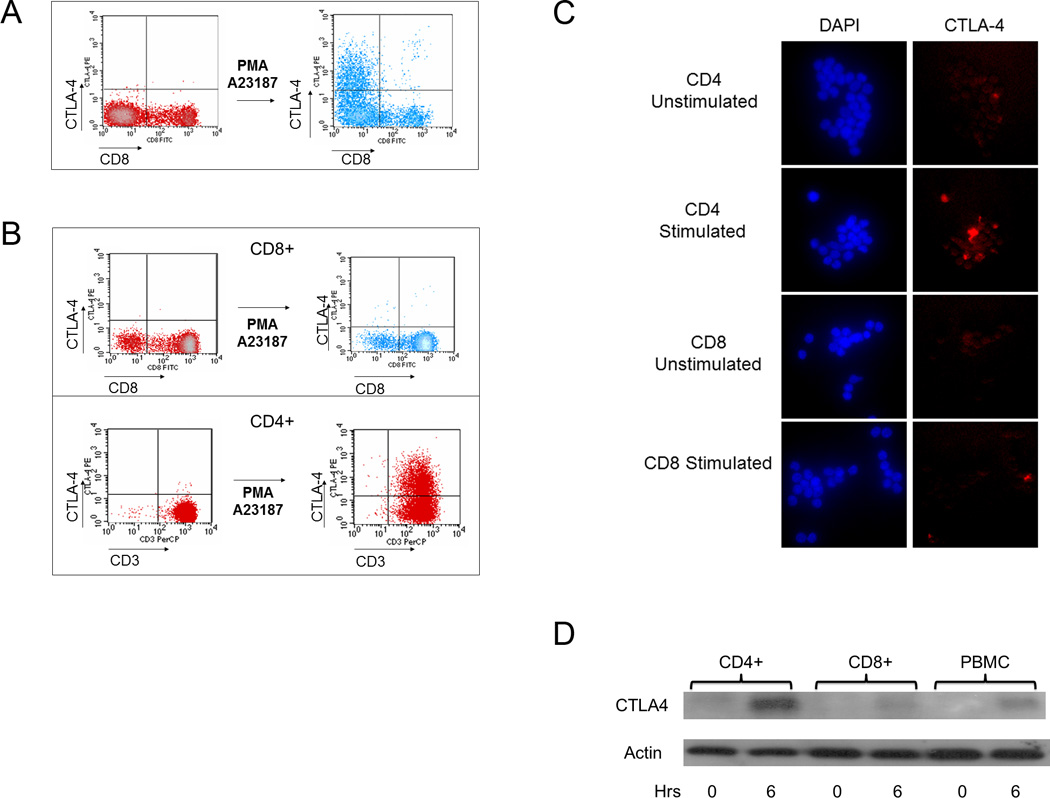
Figure 1. CTLA-4 is preferentially induced in CD4 vs. CD8 T cells.

(a) The level of CTLA-4 expression was measured by flow cytometry before and after stimulation with PMA/A23187 as described in the Materials and Methods. Few CD8+ T cells express CTLA-4, suggesting that CTLA-4 is expressed mainly in non-CD8+ T cells. The results are representative of findings from three normal volunteers. (b) CD4 and CD8 T cells were purified using negative selection as described in the Materials and Methods. After stimulation with PMA/A23187, CTLA-4 expression was measured. CTLA-4 was minimal on the purified CD8+ subset (top panel) but was detected on the purified CD4+ subset (bottom panel). The results in each panel are representative of findings from three normal volunteers. (c) CTLA-4 is preferentially increased in stimulated CD4+ vs. CD8+ cells as assessed by immunofluorescence. Purified cells were stimulated with PMA/A23187 and fixed as described. Cells were stained with DAPI and anti-CTLA-4-PE as described in the Materials and Methods. Results are representative of three independent experiments. d) CD4+ and CD8+ T cells as well as bulk PBMCs were analyzed for total CTLA-4 expression. 10 million of each purified cell type was used in conditions following stimulation by PMA/A23187 as indicated. Following treatment with PMA/A23187 for 0 or 6 hours (horizontal axis), total protein was isolated as described in the Materials and Methods. 10 ug of total protein was separated by SDS-PAGE, transferred to PVDF membrane and immunoblotted for total CTLA-4 levels using anti-CTLA-4 followed by visualization by chemiluminescence.
