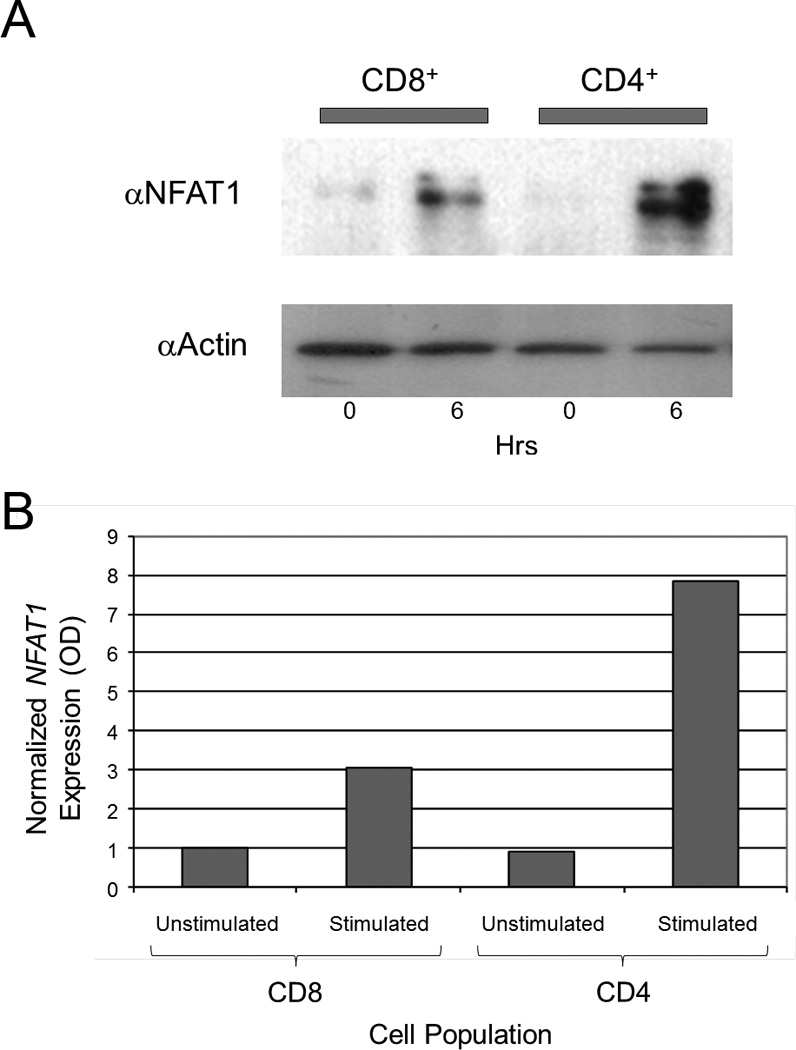
Figure 4. NFAT1 is increased in CD4+ T cells compared to CD8+ T cells.

(a) NFAT1 is increased in stimulated CD4+ cells vs. stimulated CD8+ cells by immunoblot. Total protein was isolated from purified unstimulated (0 hours, horizontal axis) and stimulated (6 hours, horizontal axis) CD4+ and CD8+ T cells. Equal amount amounts of protein (10 µg) was analyzed by SDS-PAGE and immunoblotted against NFAT1 with an anti-NFAT1 antibody (αNFATc2) as shown. The level of actin was determined by immunoblotting the same membrane with an anti-actin antibody (αActin) after stripping the anti-NFAT1 to control for equal protein loading. Results are representative of three independent experiments. (b) NFAT1 expression was measured by qRT-PCR and normalized to β2-microglobulin. Stimulated CD4+ cells show higher relative expression of NFAT1 compared to stimulated CD8+ cells.
