
Figure 4. Relative location of domains in M3+TE.
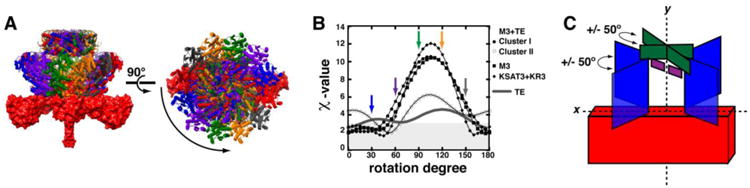
In order to assess the most accurate placement of the KR3, ACP3, and TE domains relative to the KSAT3 didomain, a library of models were generated for M3+TE (clusters I & II), M3, and KSAT3+KR3 by rotating the appropriate domains in each average structure 175°about the axis of symmetry in 5° increments. (A) Examples of the M3+TE structures at 0°, 30°, 60°, 90°, 120°, and 150° are shown colored with red, blue, purple, green, gold, and grey, respectively. (B) Each orientation was then fit to the SAXS data using CRYSOL, and the resulting χ-values were plotted as a function of the rotation angle (χ-values ≤ 2.5 are shaded in grey). For M3+TE cluster I, the KSAT3, KR3, and ACP3 domains were also held at the 0° position, and only the TE domain was rotated; this is shown as a grey line. (C) SAXS-derived datasets agree well with models in which the KR and ACP domains are positioned within 50° of the KS-AT xy-plane and where the TE dimer is positioned within 50° of the KR xy-plane.