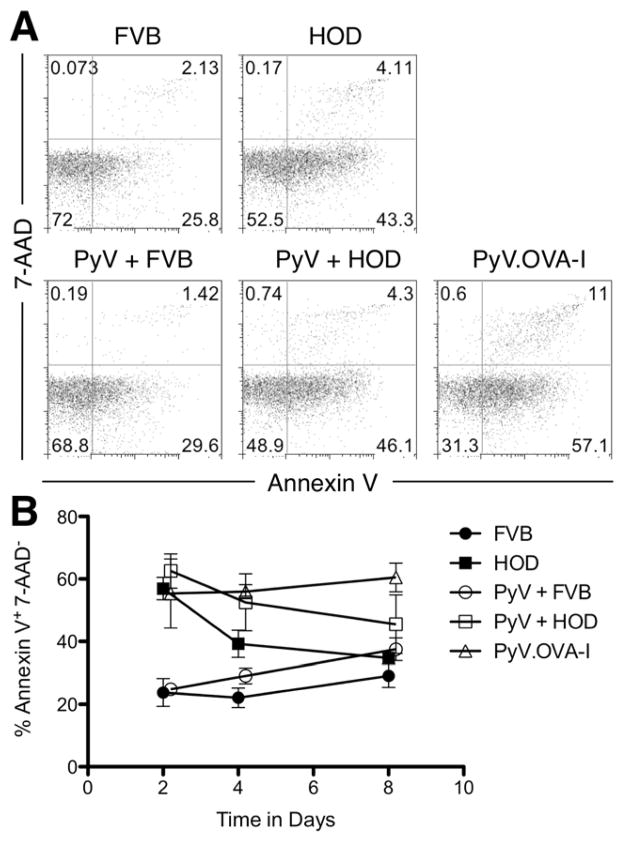
Figure 5. Measurement of apoptosis in OT-I T cells stimulated with HOD RBCs.
Apoptosis in live adoptively transferred OT-I cells was measured by staining splenocytes of recipient mice with Kb/SIINFEKL tetramer, 7-AAD, and Annexin V. Representative flow cytometry plots gated on the CD8+ KbSIINFEKL tetramer+ events for the different experimental groups at day 4 after transfusion/infection are shown (A). Data shown are the compounded results of 2 separate experiments with 2 mice per group. Symbols: FVB ●, HOD ■, PyV + FVB ○, PyV + HOD □, PyV.OVA-I △. Error bars represent the standard error of the mean for the data point (B).

