Fig. 5.
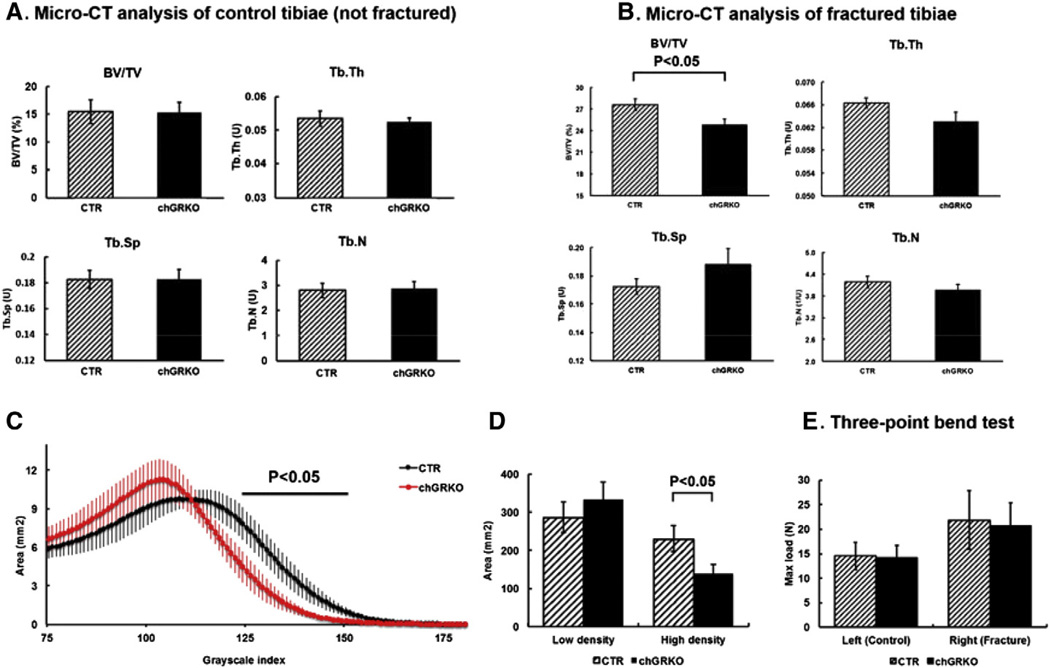
Micro-CT and mechanical analysis of tibiae 4 weeks after the metaphyseal fracture surgery. A, no difference was observed in control tibiae (left side) between chGRKO and CTR mice in BV/TV, Tb.Th, Tb.Sp or Tb.N; B, in fractured tibiae (right side), BV/TV was significantly decreased in chGRKO mice compared with CTR mice. There was also a trend towards decreased Tb.Th and Tb.N, and increased Tb.Sp observed in chGRKO mice, which is consistent with the decreased BV/TV, although no statistically significant difference was detected; C, distributions of the mineral density for repaired bone of the chGRKO and CTR mice. The threshold value for the binarization of the micro-CT images (75) corresponds to the lowest value in the diagram. chGRKO mice exhibited a different distribution pattern from CTR mice; D, The healed callus was classified as low-density bone when the grayscale value exceeded ‘75’ but was below ‘110’; grayscale values of greater than ‘110’ signified high-density bone. chGRKO mice showed no apparent difference in low-density bony callus but a significant decrease of high-density bony callus in the fracture site compared with CTR mice; E, three-point bend testing demonstrated higher max load in the control tibiae compared to fractured tibiae, with no difference between CTR and chGRKO mice.

