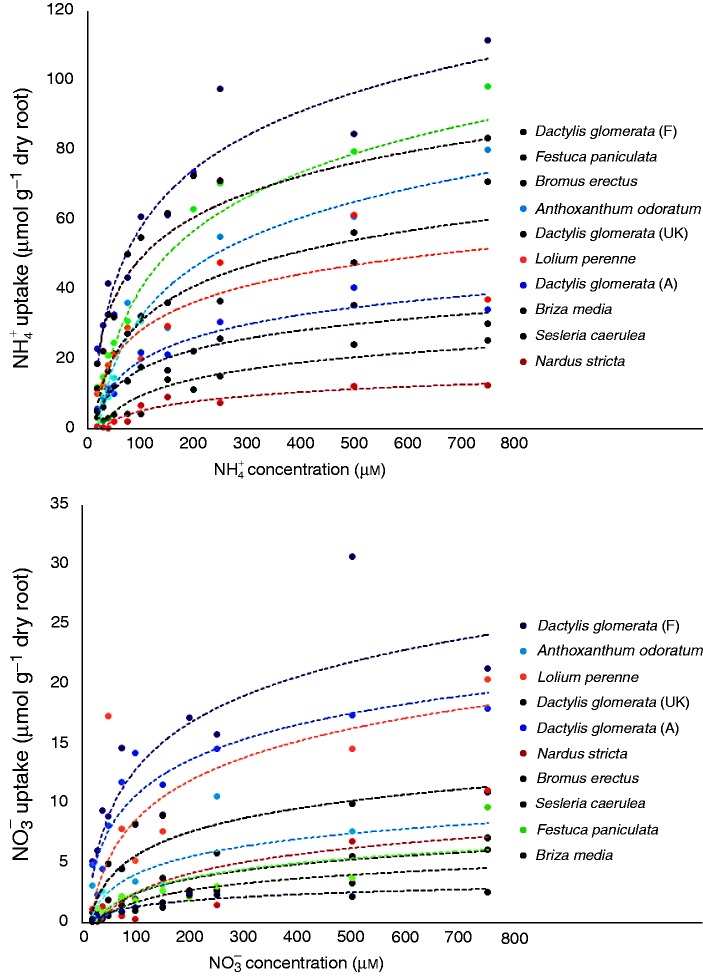
Fig. 1.
Nitrogen uptake rates of (top) and (bottom) at the different substrate concentrations. Species names in the key are ordered following the position of the regression line at the end of the N concentration axis to simplify the reading of the figure. However, the order was not necessarily the same as the ranking based on Vmax values presented in Fig. 3, which were calculated using all the points and not only the mean values per concentration presented here.

