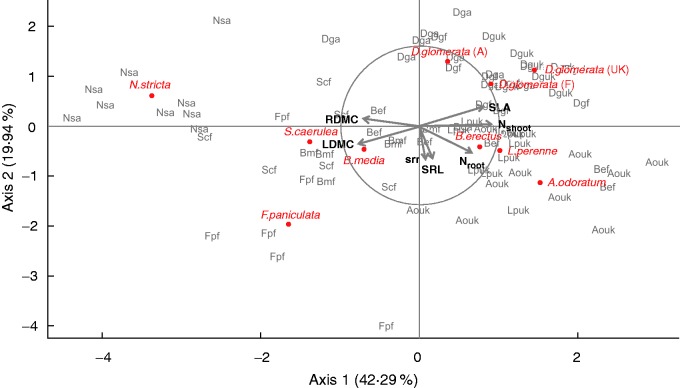
Fig. 2.
Principal component analysis (PCA) based on functional traits measured for ten replicates (in grey) of species used in the study (multivariate mean indicated in red). SRL, specific root length; SRR, shoot:root ratio; SLA, specific leaf area; LDMC, leaf dry matter content; Nshoot and Nroot, nitrogen concentration in the shoot and root, respectively. For D. glomerata, the site of origin is indicated in parentheses. Total variance explained by the two first axes: 62.93 %. Loading scores for the two first axis of the PCA for leaf and root traits are given in Supplementary Data Table S2.

