Figure 3.
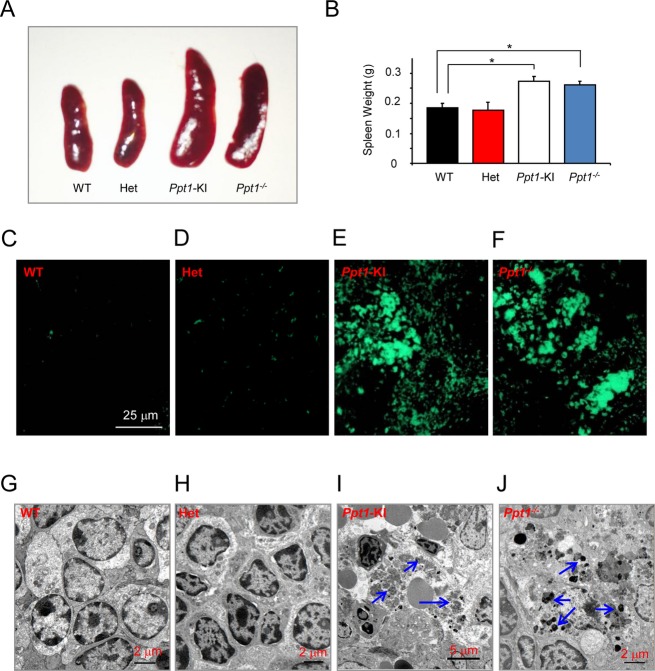
Macroscopic, histopathological, and ultrastructural analyses of the spleen. (A) Morphology of the spleen from representative heterozygous, Ppt1-KI mice and their WT littermate. The spleen from a Ppt1−/− mouse was used for comparison. Note that the increased spleen sizes in Ppt1-KI and Ppt1−/− mice are visually appreciable compared to those of the heterozygous and WT mice. (B) Spleen weights from heterozygous and Ppt1-KI mice and those of their WT littermates. Spleen weights of Ppt1−/− mice served as controls. The results are presented as the mean (n = 16) ±SD. Autofluorescent storage material in the spleen from WT (C), heterozygous (D), and Ppt1-KI (E) mice compared with those of the Ppt1−/− mouse (F), which served as a control. Note that while intense autofluorescence was readily detectable in the spleens of Ppt1-KI and Ppt1−/− mice, those of the heterozygous and WT littermates of the Ppt1-KI mice showed virtually no autofluorescence. Transmission electron microscopic analyses of GRODs in the spleen of a representative WT (G), heterozygous (H), and Ppt1-KI mice (I) compared with those of a representative Ppt1−/− mouse (J), which served as a control. Note the heavy accumulation of GRODs (arrows) in the spleens of Ppt1-KI and Ppt1−/− mice but the GRODs were not detectable in the spleen of heterozygous mice and their WT littermate. *P < 0.05, P < 0.01, P < 0.001.

