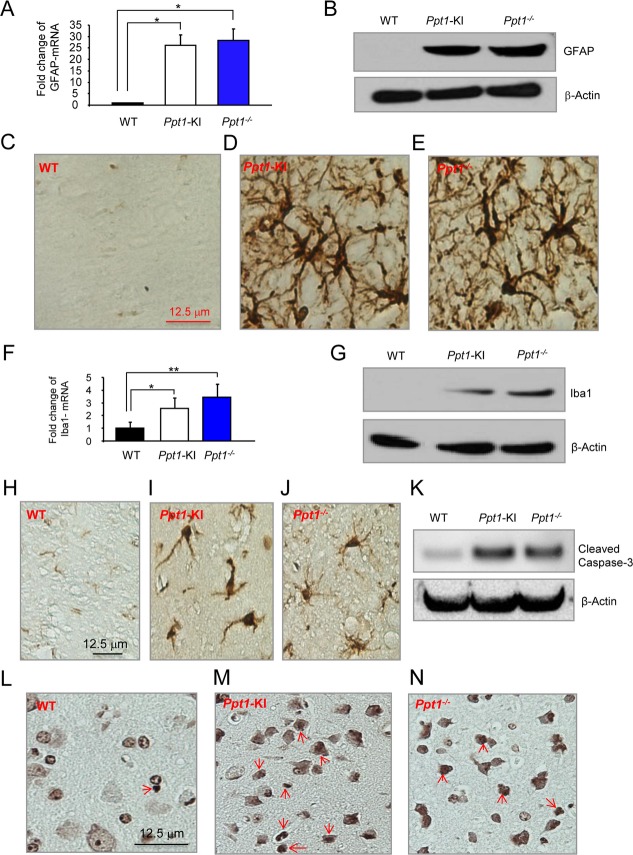
Figure 4.
Biochemical and histochemical analysis of GFAP and Iba1 levels. The GFAP-mRNA levels in the cortical brain tissues of Ppt1-KI mice as well as those of their WT littermates. The GFAP-mRNA levels in Ppt1−/− mice were used for comparison. The results are presented as the mean (n = 12) ±SD. (B) Western blot analysis of cortical tissues from for Ppt1-KI mice and their WT littermates. Cortical tissues from Ppt1−/− mice were used as a control. β-actin was used as a loading standard. Immunohistochemical staining of GFAP of the brain tissues from WT mice (C) as well as those of their Ppt1-KI littermates (D). Brain sections from Ppt1−/− mice (E) were used for comparison. The Iba1-mRNA levels (F) in the cortical tissues of Ppt1-KI as well as those of their WT littermates. The Iba1-mRNA levels in Ppt1−/− mice were used as a control. The results are presented as the mean (n = 12) ±SD. (G) Western blot analysis of cortical tissues from for Ppt1-KI mice and those of their WT littermates. Cortical tissues from Ppt1−/− mice were used as a control. β-actin was used as a loading control. Iba-1 immunohistochemical color stain in the paraffin brain sections of WT mice (H) as well as those of their Ppt1-KI littermates (I). Brain sections from Ppt1−/− mice (J) were used for comparison. (K) Western blot analysis of cleaved caspase-3 in cortical brain tissues from for Ppt1-KI mice and those of their WT littermates. Cortical brain tissues from Ppt1−/− mice were used as a control. β-actin was used as a loading control. TUNEL Stain in the paraffin brain sections of WT mice (L) as well as those of their Ppt1-KI littermates (M). Brain sections from Ppt1−/− mice (N) were used for comparison. *P < 0.05, **P < 0.01, P < 0.001.

