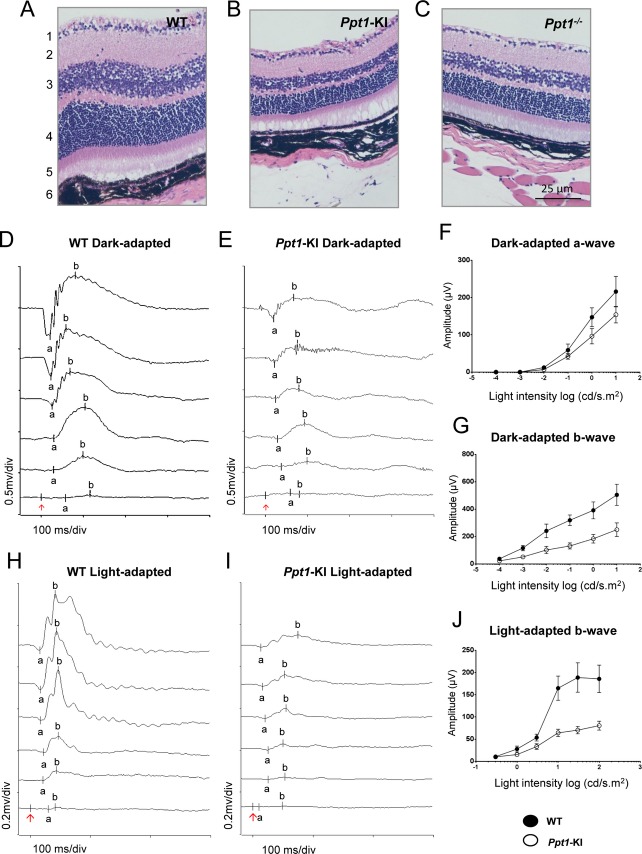
Figure 5.
Histopathological analysis of retinal layers and electroretinography. Representative hematoxylin- and eosin-stained retinas from (A) WT, (B) Ppt1-KI, and (C) Ppt1−/− mice are shown. Note that compared with the WT mice, reduced thickness of the retinal layers three (inner nuclear layer) and four (outer nuclear layer) in Ppt1-KI and Ppt1−/− mice are readily appreciable. In addition, the number of cells in retinal ganglion cell layer is also reduced in Ppt1-KI and Ppt1−/− mice compared with that of the WT control. Representative dark-adapted ERG waveforms from WT (D) and Ppt1-KI mice (E), respectively, in response to a series of light flashes with intensities of 10−4, 10−3, 0.01, 0.1, 1, and 10 cd.s/m2 (from bottom to the top traces). (F) Averaged a-wave amplitudes of dark-adapted ERG from WT and Ppt1-KI mice. (G) Averaged b-wave amplitudes of dark-adapted ERG from WT and Ppt1-KI mice. Representative light-adapted ERG waveforms from WT (H) and KI mice (I), respectively, were in response to flash intensities of 0.3, 1, 3, 10, 30, and 100 cd.s/m2 (from the bottom to the top traces). (J) Averaged b-wave amplitudes of light-adapted ERG from WT (n = 8) and Ppt1-KI (n = 8) mice.

