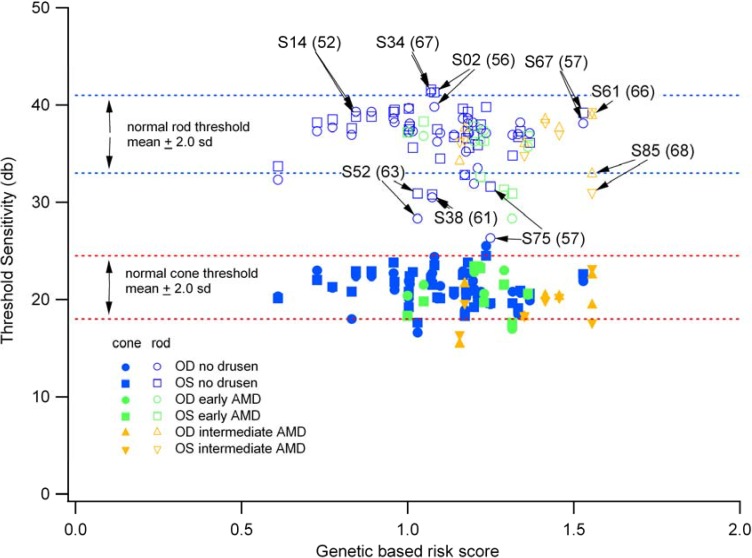
Figure 2.
Final thresholds measured psychophysically with dark-adapted microperimetry. Right (OD) and left (OS) eyes are shown separately as circles and squares, respectively. Normal ranges (±2.0 SD) are shown as dashed lines for rod-mediated function (blue lines) and for cone-mediated function (red lines).

