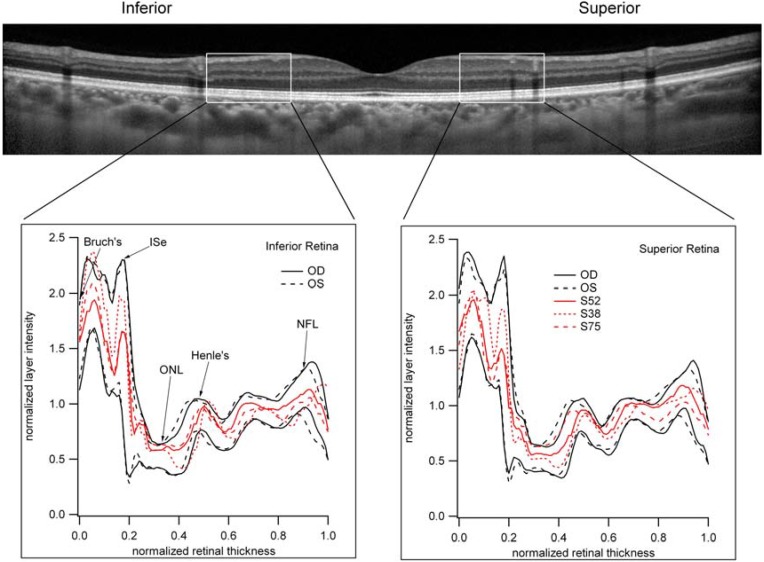
Figure 4.
Light reflectance profiles (LRP) across retinal layers as imaged by OCT. A 1 mm wide section of the retina (shown as the rectangle in the OCT image below) was sampled from Bruch’s membrane (BM) to the inner limiting membrane (ILM). Sections were centered 1mm superior and inferior of the fovea. In the bottom panels, the normal range of LRP are defined by the solid black lines. The LRPs for the three patients (S38, S52 and S75) with significantly reduced retinal sensitivity and normal appearing retina are shown as red lines. Note that the LRP for these representative subjects are well within normal limits.

