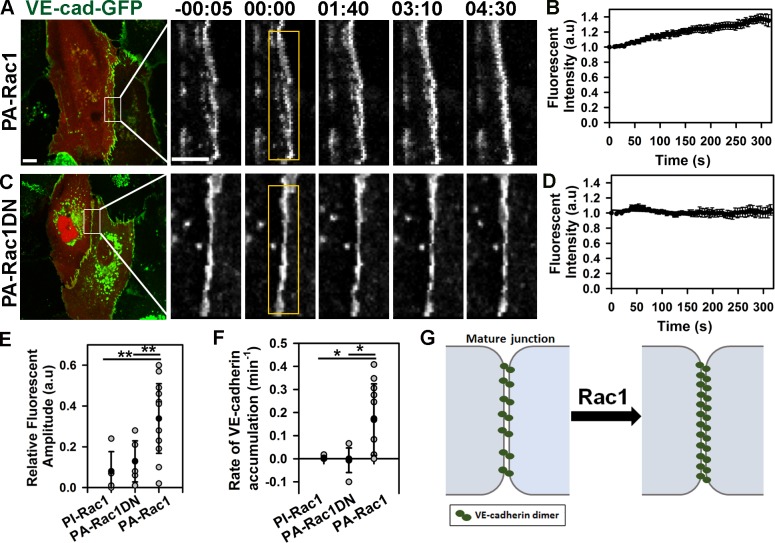
Figure 1.
Photoactivation of Rac1 at AJs increases VE-cadherin density. (A and C) Time-lapse images of VE-cadherin–GFP (VE-cad-GFP) in cells expressing either mCherry-tagged PA-Rac1 (A) or PA-Rac1DN (C) before and after photoactivation inside the yellow rectangular region at time 0. Time in minutes and seconds is shown. Bars: (main images) 10 µm (insets) 5 µm. (B and D) Relative changes in VE-cadherin–GFP fluorescence intensity at AJs within activation zone for PA-Rac1 (B) or PA-Rac1DN (D) as shown in A and C; means ± SEM, n = 6–14. (E) Amplitude of VE-cadherin–GFP accumulation after activation of PI-Rac1 (0.08 ± 0.1), PA-Rac1DN (0.13 ± 0.1), or PA-Rac1 (0.34 ± 0.17); means ± SD, n = 5–14; *, P < 0.005. (F) The rate constant for VE-cadherin–GFP accumulation after activation of PA-Rac1 was 0.17 ± 0.16 min−1, whereas no significant change was observed with PI-Rac1 or PA-Rac1DN; means ± SD, n = 5–11; *, P < 0.05. (G) Model demonstrating the relationship between Rac1 activity and VE-cadherin density at mature AJs. a.u., arbitrary unit.

