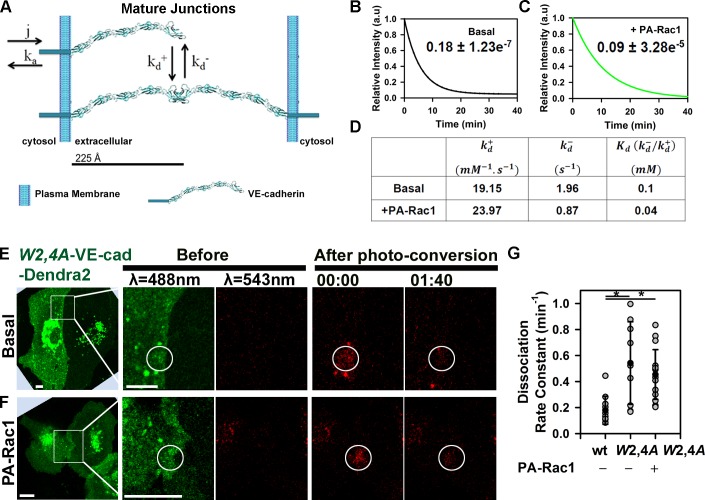
Figure 3.
Relationship between VE-cadherin kinetics at AJs and stability of adhesive bonds. (A) Mathematical model describing VE-cadherin monomer–junction association and dissociation rate constants (j and ka) followed by reversible trans-dimerization characterized by and . (B and C) COPASI-fitted experimental data from Fig. 2 (D and F) for basal (B) and after PA-Rac1 activation (C); dissociation rate constants are in minute−1 ± SEM. (D) Estimated values for and described in A. (E and F) Time-lapse images of VE-cadherin−Dendra2 (VE-cad-Dendra2) W2,4A before and after photoconversion for basal (E) and PA-Rac1 activation (F) within the irradiation zone (circles). Time is in minutes and seconds. Bars, 10 µm. (G) Dissociation rate constant for wild type (0.18 ± 0.11 min−1) and the W2,4A mutant without (0.54 ± 0.32 min−1) and with PA-Rac1 activation (0.45 ± 0.19 min−1); means ± SD, n = 9–15; *, P < 0.05. a.u., arbitrary unit.

