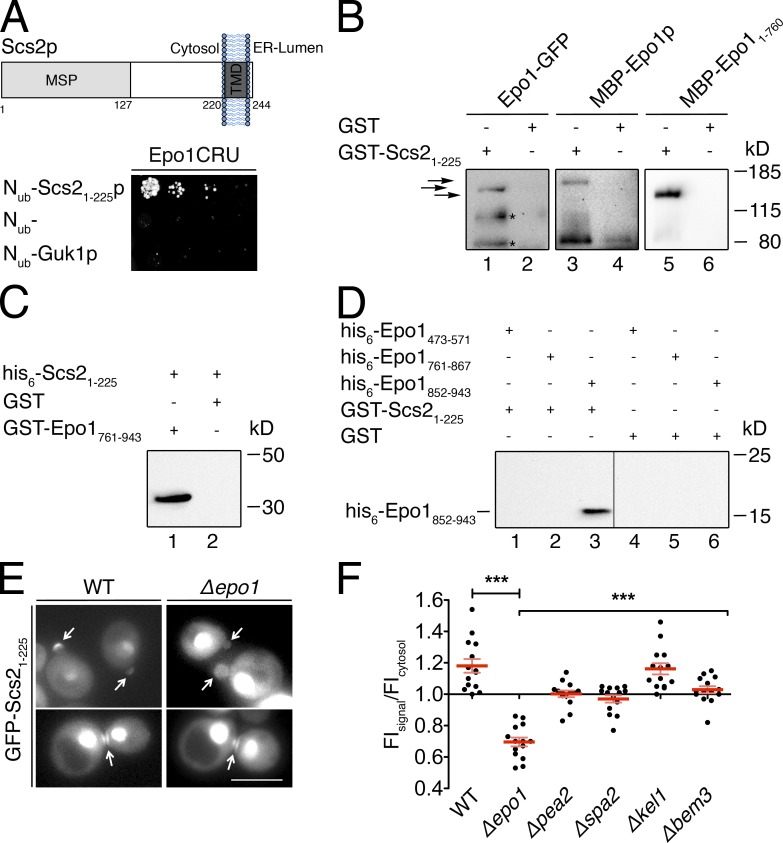
Figure 5.
Epo1p binds to two different sites in Scs2p. (A, top) Domain structure of Scs2p. The major sperm domain (MSP) is separated from the C-terminal transmembrane segment (TMD) by a stretch of 93 residues. (bottom) Split-Ub interaction assay as in Fig. 1 B but between Epo1CRU and Nub-Scs21–225 and two Nub fusions that should not interact with Epo1CRU. (B) Eluates of Sepharose bead-coupled GST-Scs21–225 (lanes 1, 3, and 5) or GST (lanes 2, 4, and 6) incubated with yeast extracts containing GFP-tagged Epo1p (lanes 1 and 2) or bacterial extracts containing MBP-Epo1p (lanes 3 and 4) or MBP-Epo11–760 (lanes 5 and 6) were separated by SDS-PAGE. Western blots were probed with anti-GFP (lanes 1 and 2) or anti-MBP antibodies (lanes 3–6). Arrows indicate from top to bottom: MBP-Epo1p, Epo1-GFP, and MBP-Epo11–760. Fragments of Epo1-GFP and MBP-Epo1p running <80 kD and interacting nonspecifically are not depicted. Asterisks indicate proteolytic fragments of Epo1-GFP. (C) As in B but with eluates of Sepharose bead-coupled GST-Epo1761–943 (lane 1) or GST (lane 2) incubated with bacterial extracts containing his6-Scs21–225. The Western blot was probed with anti-His antibodies. (D) As in B, but with eluates of Sepharose bead-coupled GST-Scs21–225 (lanes 1–3) or GST (lanes 4–6) incubated with bacterial extracts containing his6-tagged Epo1473–571 (lanes 1 and 4), Epo1761–867 (lanes 2 and 5), or Epo1852–943 (lanes 3 and 6). The Western blot was probed with anti-His antibodies. The vertical line indicates the removal of a lane loaded with a molecular mass marker. (E) Fluorescence microscopy of WT or Δepo1 cells expressing GFP-Scs21–225 from the PMET17 promoter. Cells were grown in medium containing 70 µM methionine to moderately express the GFP fusion. Top and bottom images show representative yeast cells during polar growth and during cell separation, respectively. Arrows indicate the GFP-Scs21–225 staining at bud tip and bud neck. Bar, 5 µm. (F) Quantification of relative FIs of GFP-Scs21–225 at the bud tips of WT cells and cells lacking the indicated genes (n = 14; error bars show SEM). ***, P < 0.001. The inputs for the experiments in C and D are shown in Fig. S1.

