Figure 6.
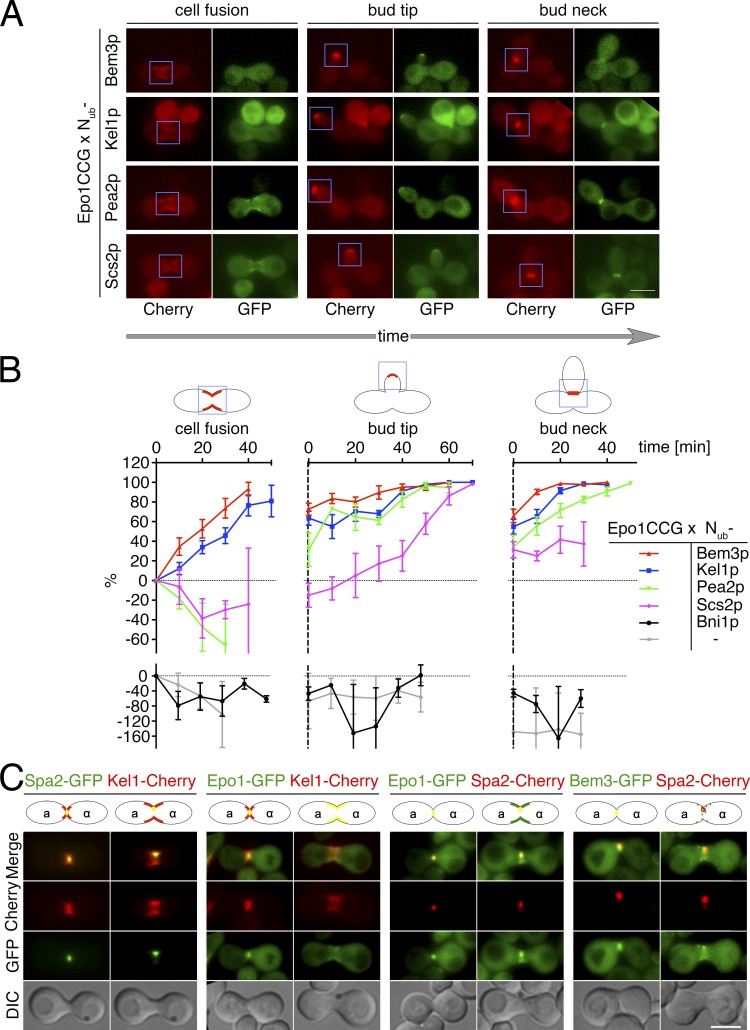
Epo1p interacts with Scs2p only during polar cell growth. (A) SPLIFF analysis of Epo1CCG. a cells expressing Epo1CCG were mated with α cells expressing (from top to bottom) Nub-Bem3, Nub-Kel1p, Nub-Pea2p, or Nub-Scs2p. Shown are the GFP and Cherry images of cells shortly after cell fusion (cell fusion, left column), during polar growth (bud tip, middle column), and during cell separation (bud neck, right column). Blue frames indicate the areas used for the quantification of the Cherry and GFP fluorescence at the respective phases of the cell cycle. (B) The calculated fractions of converted Epo1CC in cells expressing the indicated Nub fusions were plotted against time. Shown are the means of 7 < n < 13 independent matings (error bars show SEM). Note that Nub-Bni1p and the Nub without an attached yeast protein do not interact with Epo1CCG. The cartoons above the graphs indicate the respective cell cycle stages. The blue rectangles mark the areas used for signal quantification, and the red lines indicate the positions of Epo1CCG and Epo1CC appearance. (C) Microscopy of cells coexpressing (from the left to the right) Spa2-GFP/Kel1-Cherry, Epo1-GFP/Kel1-Cherry, Epo1-GFP/Spa2-Cherry, and Bem3-GFP/Spa2-Cherry. Shown are images of the diploid cells shortly before and after cell fusion. The cartoons above the images were intended to help positioning of the GFP and Cherry fluorescence with respect to the cell. Bars, 5 µm.

