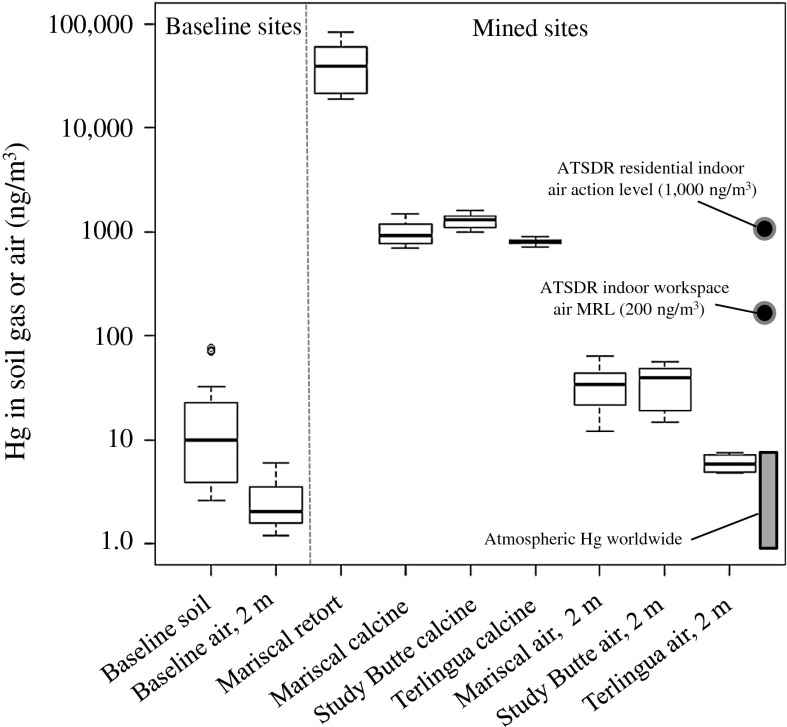
Fig. 8.
Box and whisker plot of Hg in soil gas and air samples. The box represents the interquartile range (IQR), where the upper and lower limit of the box represents the 0.75 and 0.25 quartile of the data, respectively. The solid line in the box is the median data point. The top and bottom whiskers are 1.5 X the IQR. The open circles (o) outside of the whiskers are outlier data exceeding 1.5 X the IQR. Points of reference for indoor air space are from the ATSDR, Agency for Toxic Substances and Disease Registry (ATSDR 2012). The range of concentration for atmospheric Hg worldwide (Fitzgerald 1986; Porcella 1994; Lamborg et al. 2002) is also shown for reference

