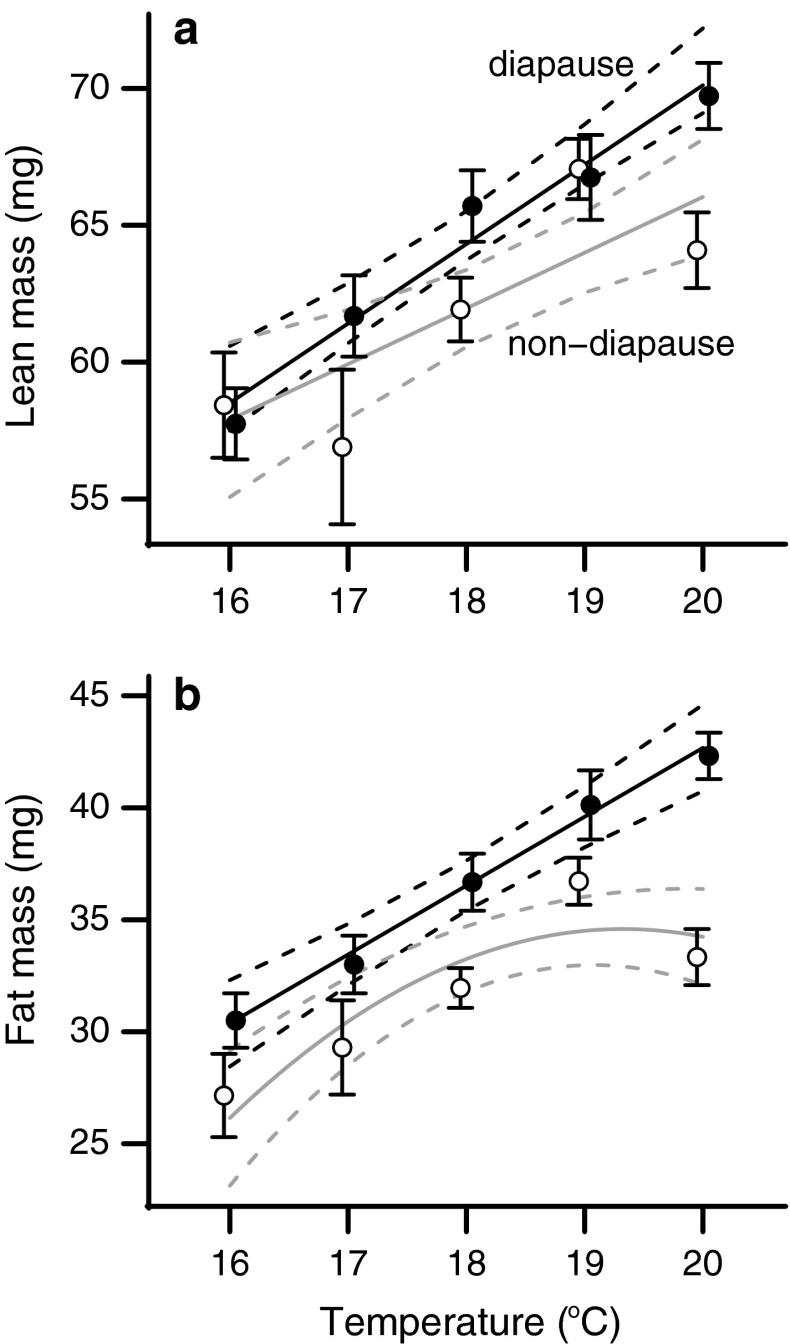
Fig. 2.
Temperature–size responses for a lean mass and b fat mass. Diapause individuals (closed circles) had overall greater lean mass and a linear increase in fat mass, while non-diapause individuals (open circles) had a quadratic relationship that leveled off at higher temperatures. Points show the mean response for each temperature and error bars indicate SEM. Solid lines connect the predicted value of the individual best-fit model for diapause and non-diapause groups, and dashed lines show the 95 % confidence interval around the predicted value

