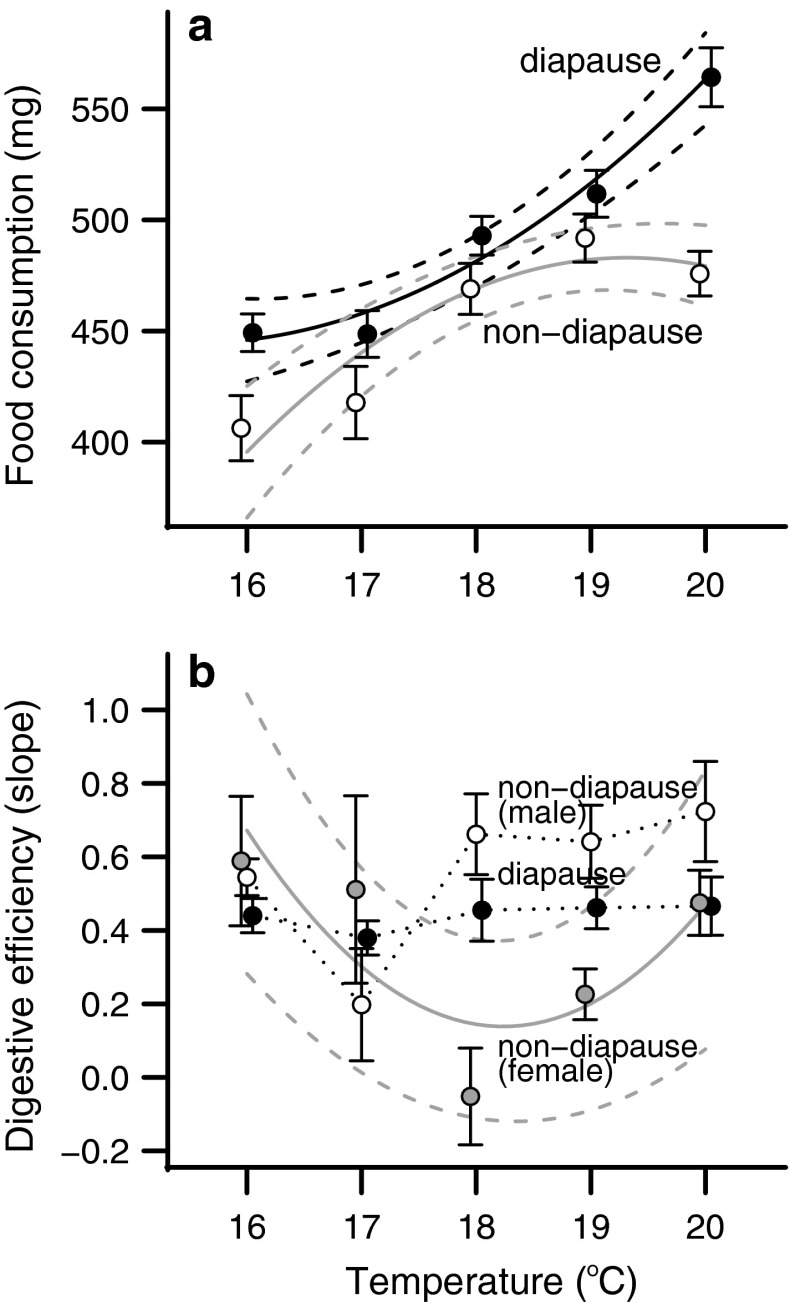
Fig. 3.
Temperature responses for a food consumption and b digestive efficiency, measured as the slope of the relationship between consumption and waste production, with lower slopes indicating greater digestive efficiency. Points show the mean response for each temperature and error bars indicate SEM. a Diapause individuals (closed circles) ate progressively more than non-diapause individuals (open circles), but did not differ in amount of waste produced. Solid lines connect the predicted value of the individual best-fit model for diapause and non-diapause groups, and dashed lines show the 95 % confidence interval around the predicted value. b Digestive efficiency for diapause individuals (closed circles) and male non-diapause individuals (open circles) was dependent on food consumption and not temperature. For female non-diapause individuals (gray circles), digestive efficiency depended on temperature and individuals were most efficient at intermediate temperatures. Points show the mean response for each temperature and error bars indicate SEM. Solid lines connect the predicted value of the individual best-fit model for diapause and non-diapause groups, and dashed lines show the 95 % confidence interval around the predicted value. b Dotted lines indicate groups that do not have significant temperature effects

