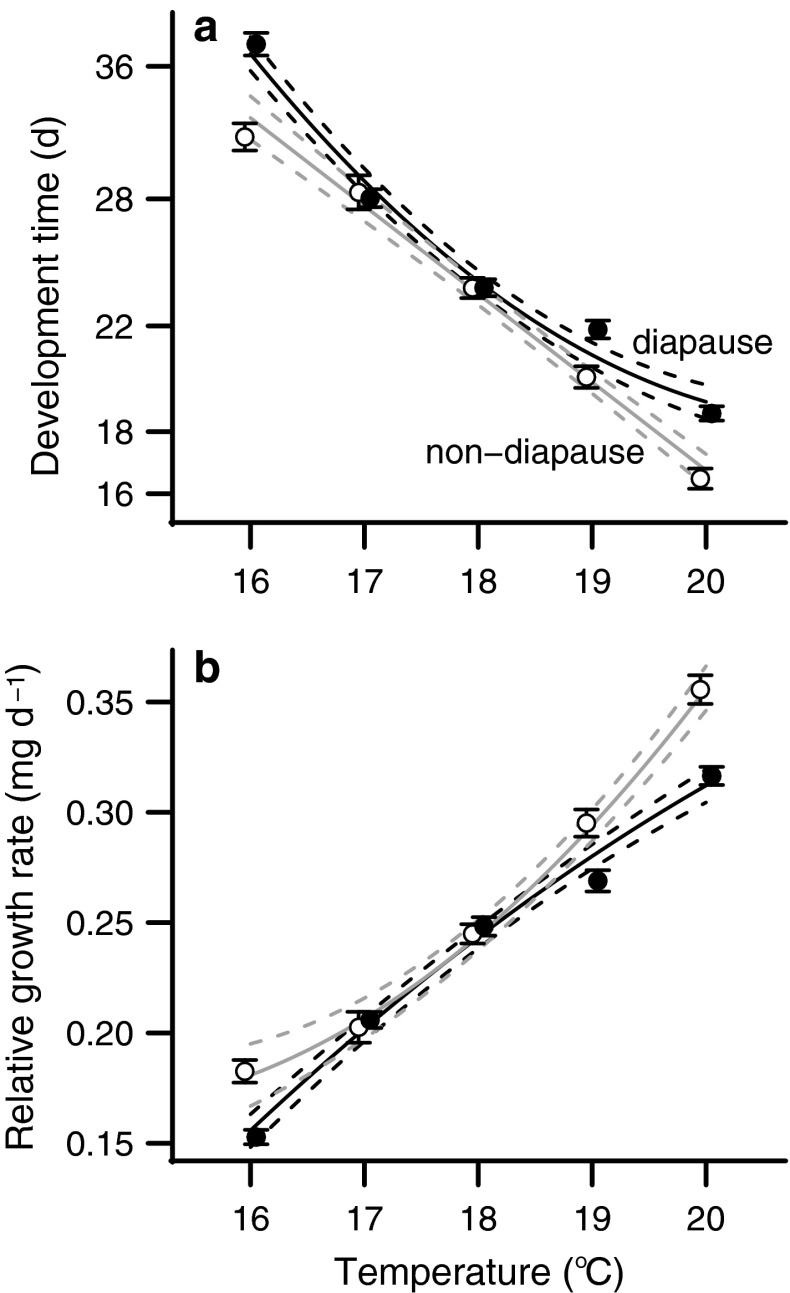
Fig. 4.
Temperature responses for a development time and b relative growth rate. As temperature increased, diapause individuals (closed circles) had longer development times and slower development rates than non-diapause individuals (open circles). a Development time axis in days (d) is on a log scale. Points show the mean response for each temperature and error bars indicate SEM. Solid lines connect the predicted value of the individual best-fit model for diapause and non-diapause groups, and dashed lines show the 95 % confidence interval around the predicted value

