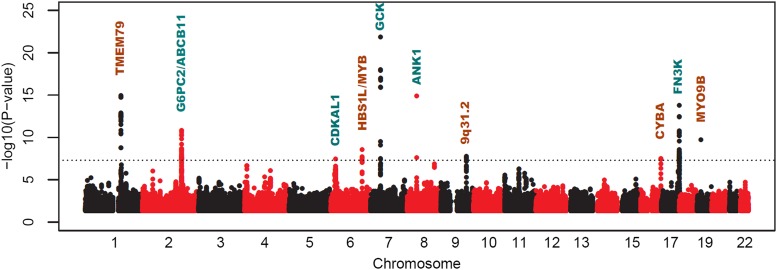
Figure 1.
Manhattan plot of genome-wide meta-analysis of stage 1 cohorts. The −log10 of the association P values (y-axis) are plotted against the genomic coordinates (x-axis). The horizontal line in the plot indicates the genome-wide significance (5 × 10⁻⁸). The most relevant gene of each signal was labeled on the top of it, with the novel loci presented in brown and known loci in blue.

