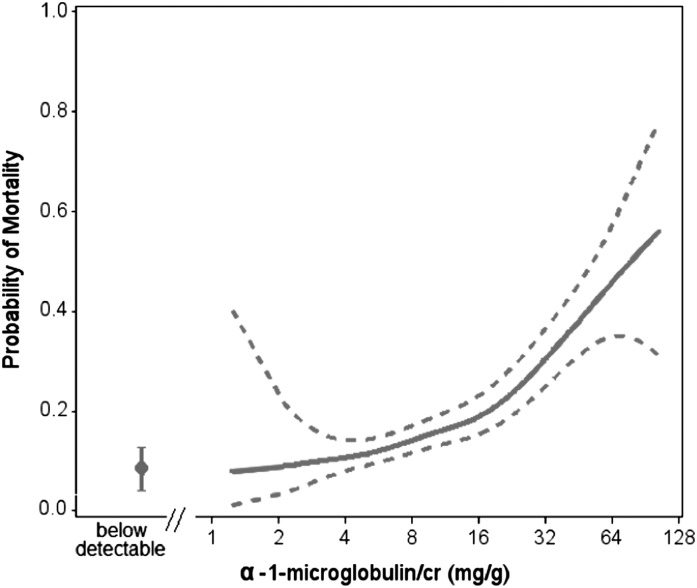
Figure 2.
Spline plot displaying unadjusted association of urine α1-microglobulin with mortality over a median follow-up of 8 years. Solid line denotes predicted probability of mortality; dotted lines represent 95% confidence bounds. Below detectable estimate represents the proportion of deaths in individuals with undetectable α1-microglobulin. The highest 2.5% of values were truncated. P<0.001 for association of urine α1-microglobulin–to-creatinine ratio with mortality. P=0.37 for test of nonlinearity. cr, creatinine.

