
Figure 2.
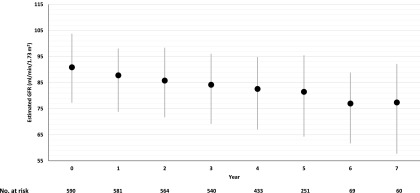
eGFR over time in 590 participants in the Action to Control Cardiovascular Risk in Diabetes Trial subcohort. Mean absolute follow-up values are shown (black circles). Error bars (gray vertical lines) indicate interquartile ranges.
Official websites use .gov
A
.gov website belongs to an official
government organization in the United States.
Secure .gov websites use HTTPS
A lock (
) or https:// means you've safely
connected to the .gov website. Share sensitive
information only on official, secure websites.
eGFR over time in 590 participants in the Action to Control Cardiovascular Risk in Diabetes Trial subcohort. Mean absolute follow-up values are shown (black circles). Error bars (gray vertical lines) indicate interquartile ranges.