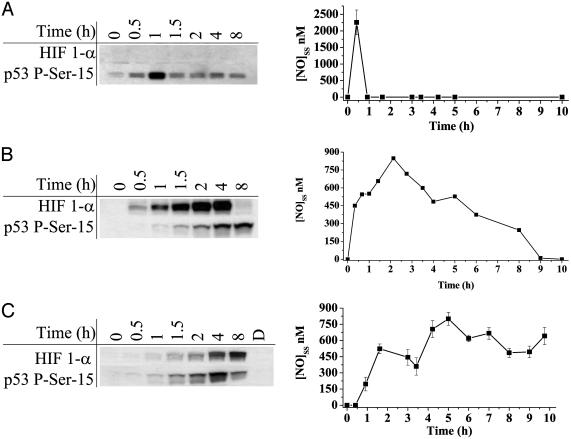
Fig. 4.
HIF-1α and p53 P-Ser-15 accumulation in response to various durations of NO exposure and real-time quantification of NO concentration. MCF7 cells were grown as in Fig. 1 and exposed to the NO donors. (A) 100 μM DEA/NO. (B) 100 μM Sper/NO. (C) 1,000 μM DETA/NO. NO steady-state levels were quantified as in Fig. 2B.

