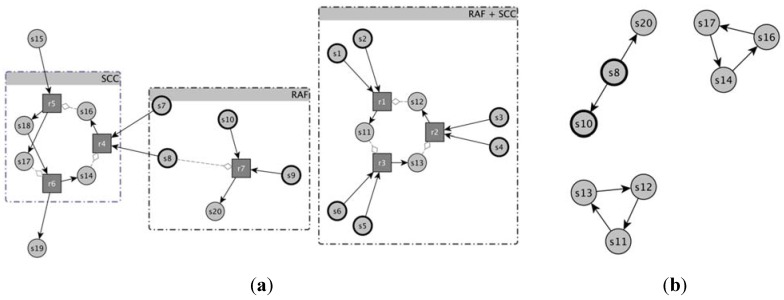
Figure 1.
An example of representation of a catalytic reaction network (a) by means of a complete reaction graph and (b) the same example by means of the catalyst → product representation. (a) Circles stand for molecular species and in particular bold circles represent species belonging to the food set F. Squares depict reactions, straight arrows indicate the participation of a species to the reaction as substrate (edge points to the reaction) or product (edge starts from the reaction). Catalysts are represented by gray lines ending with diamonds. For the sake of comprehension, both molecular species and reactions forming RAFs and SCCs are grouped together; (b) In this representation just the catalytic activity of the reaction network is depicted, and no information about the substrates of the reactions is present. By means of this representation two SCCs are clearly visible and they are formed from s11, s12, s13 and s14, s16 and s17, respectively.

