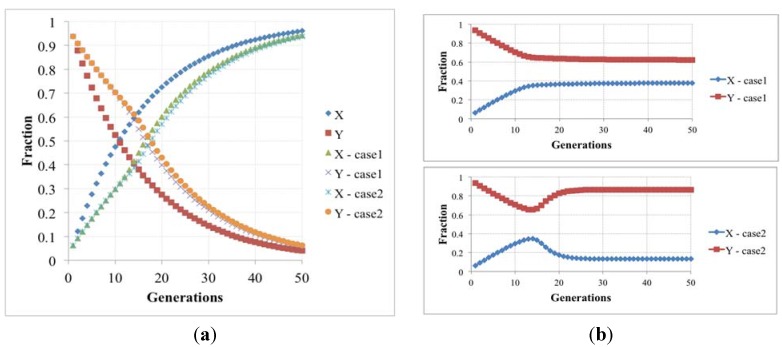
Figure 5.
(a) The fraction of protocells with only one (X) and two (Y) irrRAFs having different growth rates, in the case of no limitations, and resource limitation or overcrowding (we show two cases with different β values, respectively 5.0 × 10⁻⁶ and 1.0× 10⁻⁶); (b) The latter case when the losing irrRAF has positive effects on the resource limitation or overcrowding (case1 and case2, where β changes from 5.0 × 10⁻⁶ to 5.88 × 10⁻⁶ and from 1.0 × 10⁻⁶ to 1.5 × 10⁻⁶, respectively).

