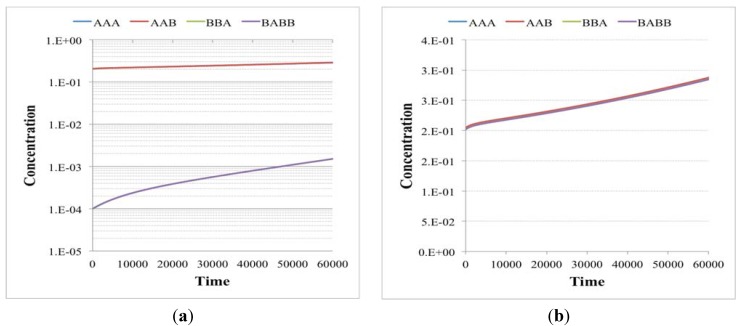
Figure 6.
Concentrations in time (arbitrary units) of chemical species of independent irrRAFs having the same growth rate but starting from different initial concentrations (a) when the second irrRAF makes its first appearance (plot from the birth of the protocell to its duplication event—note the logarithmic scale on the y-axis) and (b) when the second irrRAF reaches the first one, at the 20th generation. Simulations made with irrRAFs competing for same substrates gave similar results.

