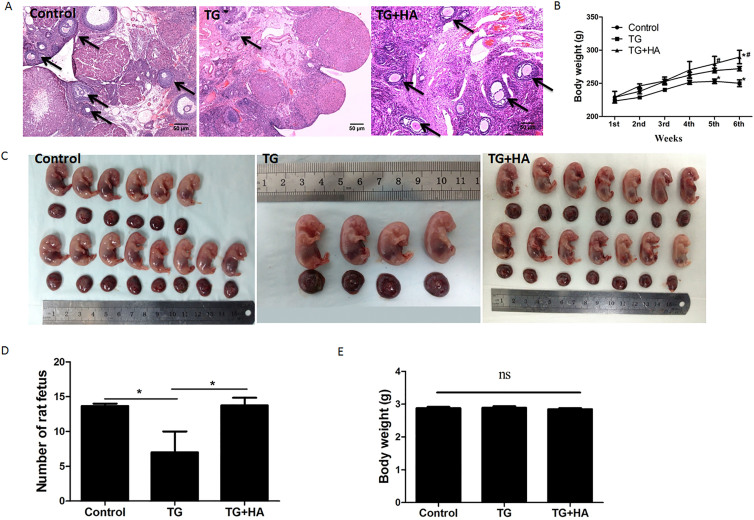
Figure 3. Ovary function evaluation in rats treated with TG and HA.
(a) The density and structure of follicles in rat ovaries were analyzed using hematoxylin and eosin staining. The arrows indicate the follicles. Bar: 50 μm; (b) The body weight of each rat in control, TG, and TG + HA groups was measured each week. *P < 0.05 vs. control; #P < 0.05 TG + HA vs. TG. (c) At day 19 of gestation, the uteri of anesthetized rats were celiotomized and pictures of the embryos were taken. (d) The number of embryos from each rat was counted.*P < 0.05, **P < 0.01 compared with control. (e) At day 19 of gestation, the uteri of anesthetized rats were celiotomized and the weight of each embryo was measured.

