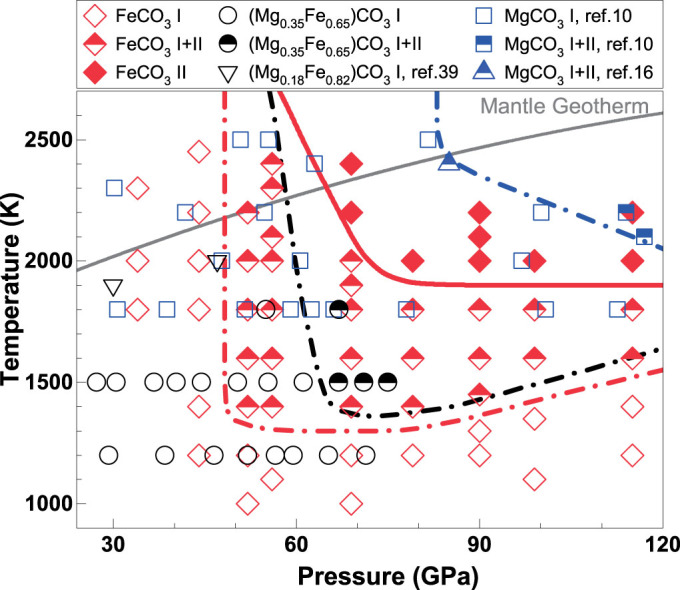
Figure 5. Experimentally observed phases in the (Mg,Fe)CO3 system at high P-T.

Open, half-filled, and solid diamonds: phase I, I+II, and II, respectively, for siderite [FeCO3] (this study); open and half-filled squares: phase I and I+II, respectively, for magnesite [MgCO3] (ref. 10); half-filled triangle: phase I and II for magnesite16; open and half-filled circles: phase I and I+II, respectively, for (Mg0.35Fe0.65)CO3 (this study); open triangles: phase I for magnesiosiderite [(Mg0.09Fe0.82Ca0.09)CO3] (ref. 39). Red, black, and blue curves: phase transformation boundary between phase I and II for siderite, magnesiosiderite, and magnesite, respectively. Gray solid curve: expected lower-mantle geotherm41.
