Fig. 1.
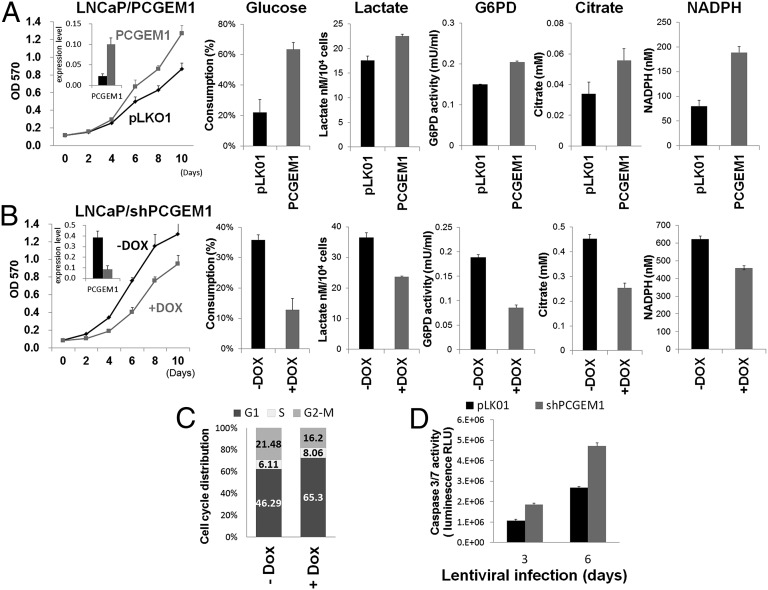
PCGEM1 regulates proliferation and metabolism. (A and B) MTT proliferation assay and metabolic profiles of PCGEM1-overexpressing cells (A) and DOX-inducible PCGEM1 knockdown cells (B). Cells were collected for metabolic enzyme reactions on day 3 after lentiviral transduction or DOX treatment and were monitored for proliferation to 10 d. The measurement of glucose consumption, lactate production, G6PD activity, and citrate and NADPH levels were normalized by cell number. SD was derived from biological triplicates. Inset graphs illustrate PCGEM1 expression level. (C) The DNA content of LNCaP/shPCGEM1 cells was detected by propidium iodide staining and flow-cytometry analysis. Population of each cell-cycle stage is quantified and plotted, as a percentage of the total cell population, in the stacked bar graph. (D) Caspase 3/7 activity was measured in LNCaP cells transduced with pLKO.1or shPCGEM1 for the indicated days.

