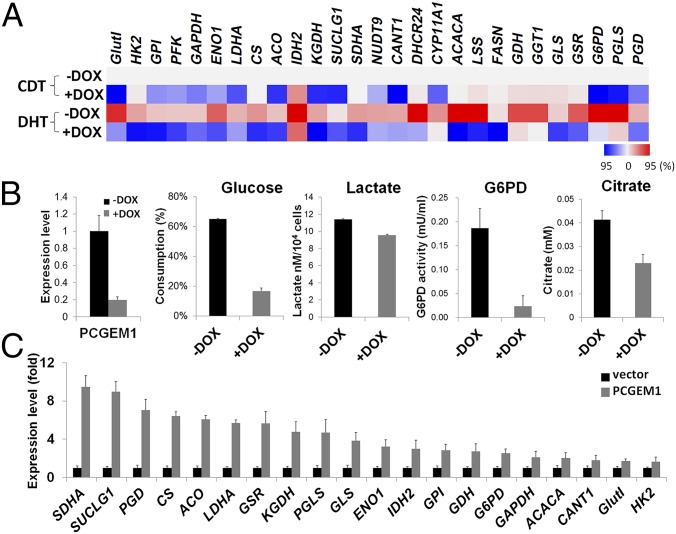
Fig. 3.
Metabolic gene regulation in androgen-dependent and -independent manners. (A) Metabolic expression profiles of LNCaP/shPCGEM1 cells cultured in hormone-deprived (CDT) or androgen-treated (DHT) conditions. The expression levels of control cells in CDT medium (−DOX CDT) were used as baseline to compare with other treatment. Relative expression fold changes are illustrated by heat map (red, up-regulation; blue, down-regulation). Color scale indicates the 95th percentile of either up- or down-regulated expression range. (B) Metabolic profiles of the PCGEM1 knockdown cell under hormone deprivation. The procedures for PCGEM1 knockdown and enzymatic reactions are as described in Fig. 1B. (C) Metabolic gene expression in PC3 cells overexpressing control vector or PCGEM1 was detected by qRT-PCR. The normalized expression levels were compared using vector control as the baseline (shown by fold, P < 0.05).

