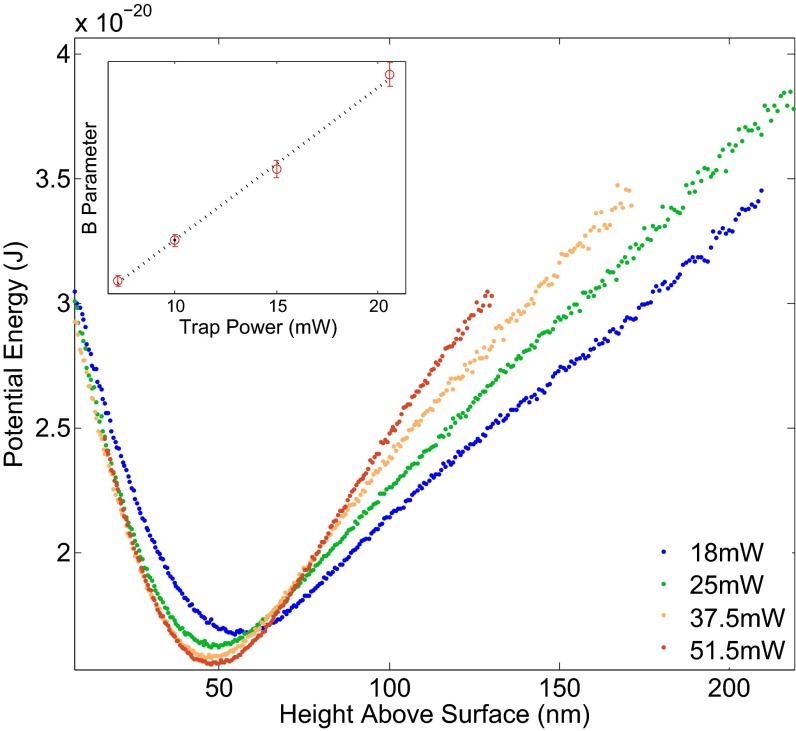
Fig. 6.
Potential energy profiles measured for four different powers of the low numerical aperture trapping beam. Curves are shifted horizontally to better visualize change in the B parameter (as defined in Eq. 9) or the slope of the linear portion of the potential. Inset shows B parameter vs. trapping power and the linear fit used to calculate the particle’s radius.

