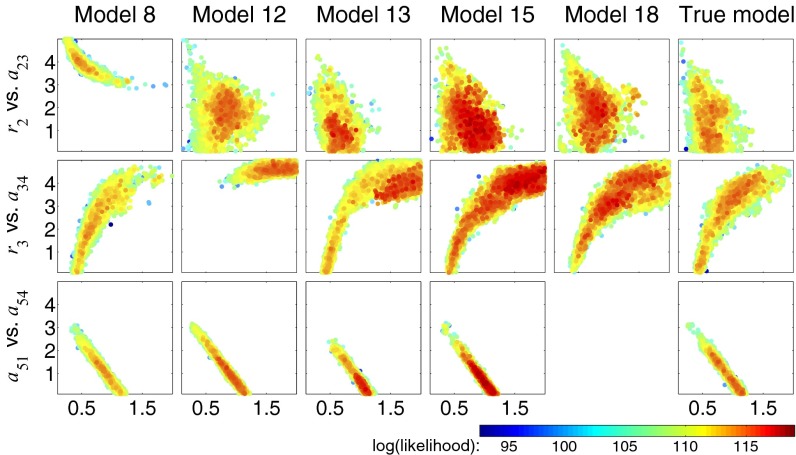
Fig. 5.
Comparison of nested sampling inference results for the best close models and the true model. Data simulated from the true model (model C) assuming additive Gaussian noise are used to infer posterior parameter distributions for the true model and 20 close models (those differing from the true model by addition or deletion of a single interaction); we assumed uniform prior distributions for all parameters (). Models with estimated evidence greater than or equal to the true model are then compared. Example bivariate scatter plots are shown for three parameter pairs for these models; each circle shows a posterior sample, with color corresponding to the likelihood value. Model 18 does not include an interaction from species 5 to species 4, hence there is no plot. See Fig. S6 for additional results.

