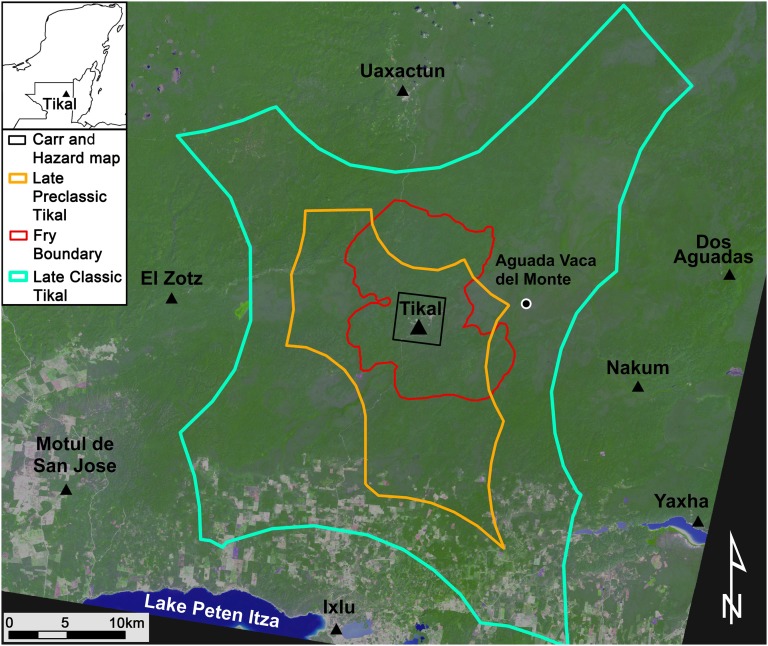
Fig. 1.
Tikal extraction zones. The Voronoi cell equal to the extractive zone during the LCP is outlined in cyan and in yellow for the Late Preclassic period. The built environment of the city, the portion that contained the majority of houses, temples, ball courts, and other structures during the LCP (in red) was determined by archaeological survey (3). The black square outlines the 9 km2 of the ceremonial core mapped by Carr and Hazard (2). Note that of the eight neighboring Maya polities used to create the LCP Voronoi diagram, Xultun is not listed. It is outside the borders of this map to the northeast of the Voronoi diagram.

