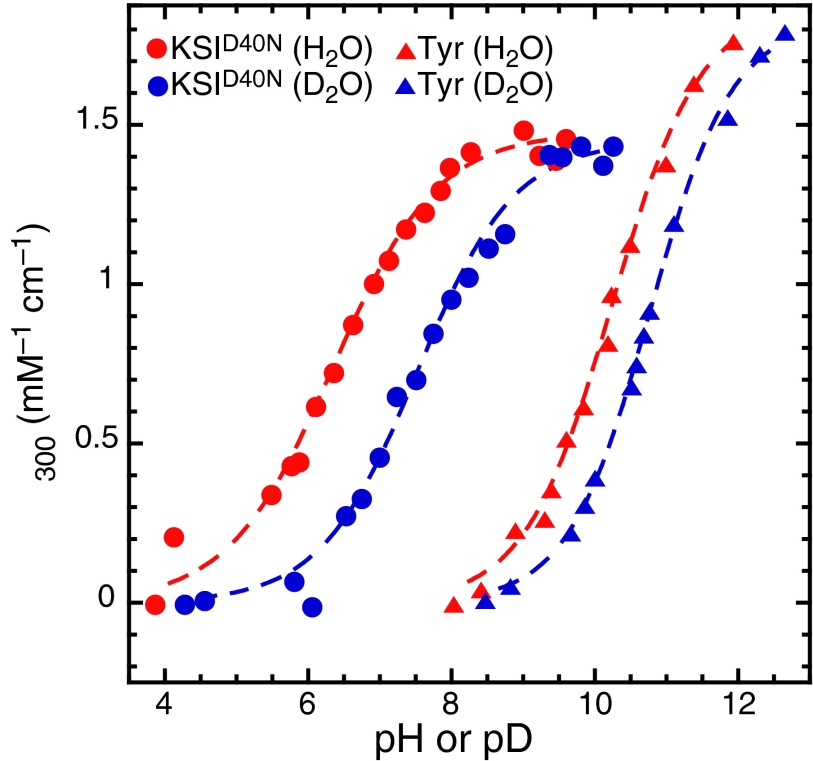
Fig. 2.
Experimental UV-Vis titration curves of (circles) and tyrosine (triangles) in buffered H2O (red) and D2O (blue). Fractional ionization of the phenolic moiety is monitored by measuring the change in absorption at 300 nm. All datasets were well-fit to a sigmoid function, admitting four values and two values (the acidity isotope effect).

