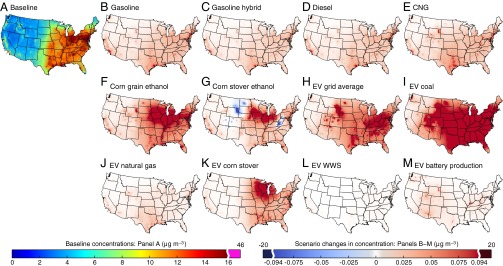
Fig. 1.

Annual average PM2.5 concentrations. (A) Year 2005 baseline modeled concentrations. (B–L) Increase in concentration above the baseline attributable to replacement of 10% of year 2020 vehicle use with the given technology. (M) Increase in concentration attributable to EV battery manufacturing. Color scales contain a discontinuity at the 99th percentile of emissions. Abbreviations: CNG, compressed natural gas vehicle; EV, electric vehicle; WWS, wind, water, or solar. Analogous plots for O3 are in Fig. S1.
