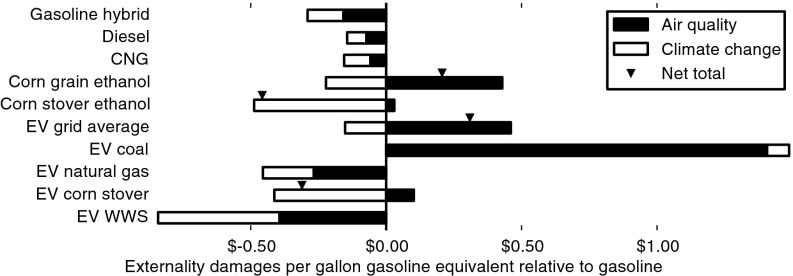
Fig. 3.
Combined air quality plus climate change externalities attributable to each scenario, relative to the gasoline scenario. [The gasoline scenario impacts (air quality, $0.53/gallon; climate change, $0.46/gallon) would equal zero on this plot.] EV scenarios include battery production. Air quality impacts include PM2.5 and O3. For bars with both positive and negative values, the triangle above each bar shows the net total impact. GHG emissions from indirect land-use change are not included. See Fig. S4 for the impact of including indirect land-use change on net GHG emissions.

