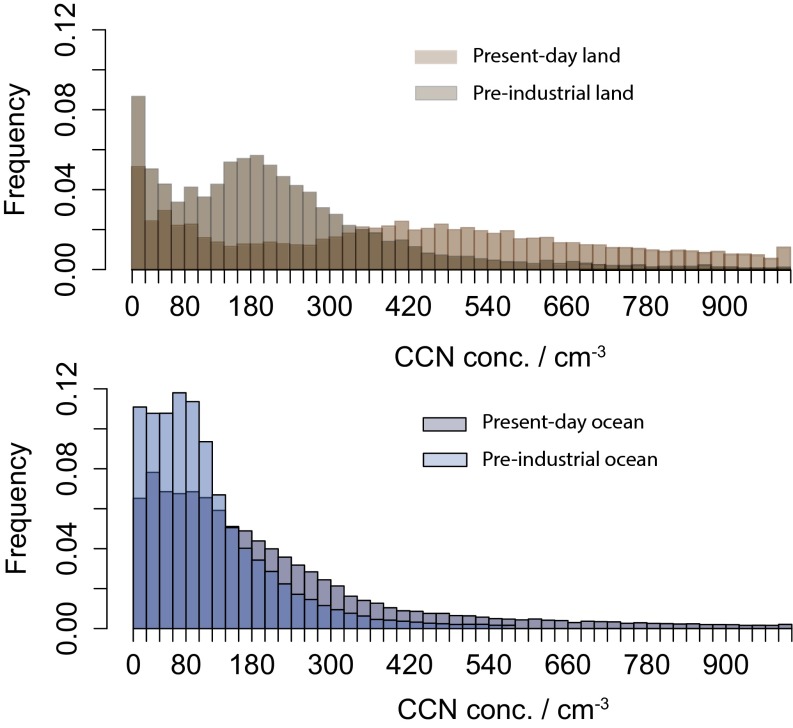
Fig. 2.
PI and PD global modeled annual mean CCN concentrations over land and ocean grid cells, calculated from daily mean CCN concentrations at cloud base (∼915 hPa). The third color indicates overlap of the two distributions. The maximum CCN bin concentration is set to 1,000 cm−3, although a small fraction exists at higher concentrations.

