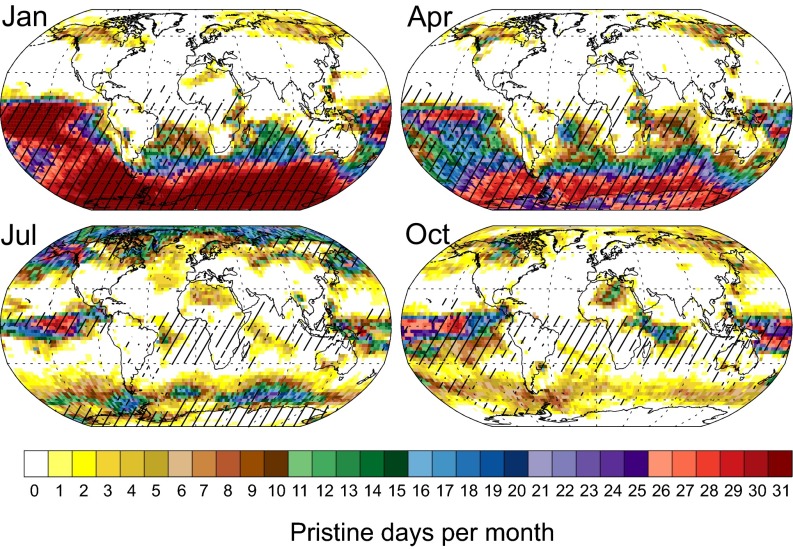
Fig. 3.
The occurrence of pristine days in January, April, July, and October, based on two definitions. Colors show the number of days per month on which PI and PD CCN concentrations differ by no more than ±20% in that grid cell at cloud base (∼915 hPa). Stippling shows regions where the sensitivities of PI and PD CCN to 28 model parameters are similar (r2 ≥ 0.9) in that grid cell at cloud base. Pristine regions are those that exhibit both a similar PI and PD CCN concentration and a similar PI and PD response to the 28 parameters.

