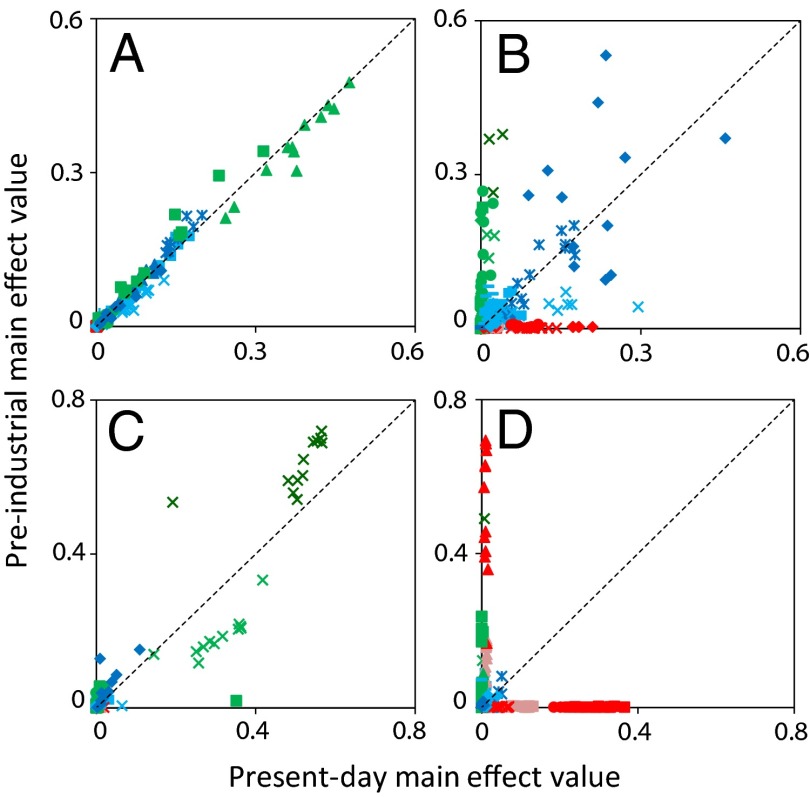
Fig. 4.
The similarity of CCN sensitivities in the PI and PD to 28 parameters covering natural emissions (green), anthropogenic emissions (red), and processes (blue) for every month in the year at four different sides: (A) Melanesia (1°S, 151°E), (B) eastern Atlantic (38°N, 21°W), (C) Brazilian rainforest (1°S, 66°W), and (D) northeast China (38°N, 111°E). For more information on individual marker descriptions, please see Table S1.

