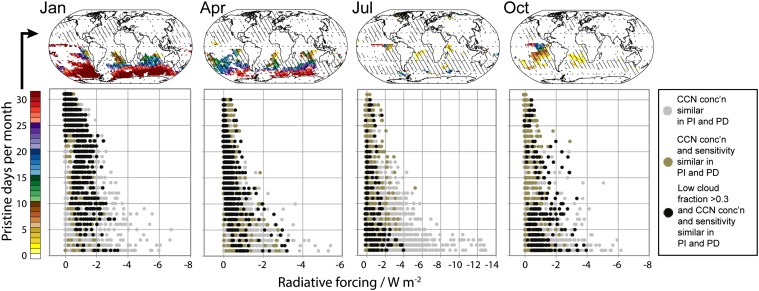
Fig. 5.
The relationship between 1750-to-2000 monthly mean aerosol indirect radiative forcing and the occurrence of pristine aerosol conditions. Maps show number of days in which pristine conditions (PI:PD CCN concentrations within ±20% and similar response to the 28 parameters in both time periods) and average low cloud fraction (≥0.3; stippling) overlap.

