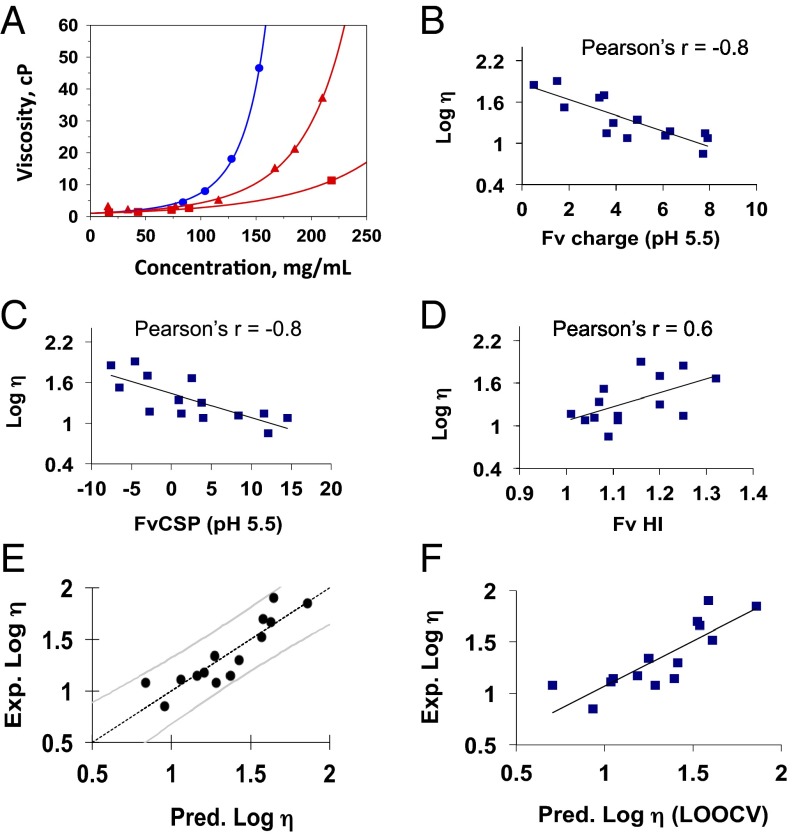
Fig. 1.
(A) Viscosity-concentration profiles of three monoclonal antibodies of the IgG1 isotype in a buffered solution at pH 5.5 and 200 mM arginine-HCl. The points represent the experimental data. The lines are used as a guide to the eye and were generated using the equation of the exponential form y = a + becx, where y is viscosity, x is protein concentration, and a, b, and c are fitting parameters. Correlation of log viscosity with the calculated sequence-based parameters of (B) charge at pH 5.5, (C) Fv charge symmetry parameter (FvCSP) at pH 5.5, and (D) Fv hydrophobicity index (HI). The viscosity values were obtained in buffered solution at pH 5.5 and 200 mM arginine-HCl. (E) Principal component regression analysis plot showing the predicted viscosity values against the experimental viscosity values for 180 mg/mL mAb concentration. The observed viscosity values are the experimental values obtained in buffered solution at pH 5.5 and 200 mM arginine-HCl. The predicted viscosity values are the output values from PCR analysis and are described by Eq. 1. Each data point represents an mAb, and the curved lines represent the 90% CIs. (F) Scatterplot between the predicted values obtained using the LOOCV approach through PCR analysis and the experimental viscosity values.

