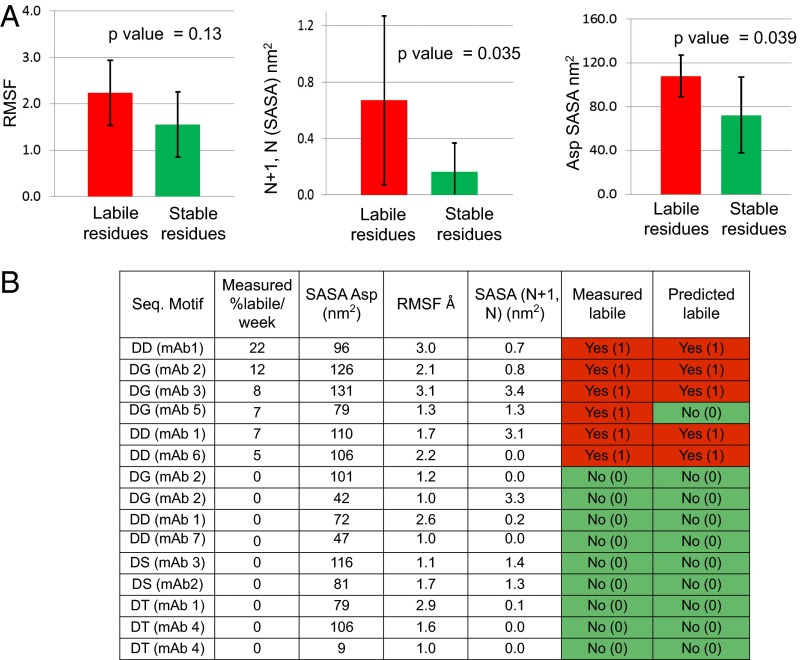
Fig. 4.
(A) Comparison of the average and SD of various properties, i.e., SASA, RMSF, and SASA (n + 1, N), extracted from MD simulations for labile group (red) vs. stable group of Asp residues (green). Calculated P values are shown on each plot. (B) Outcome of the logistical regression to enable prediction of labile vs. stable Asp sites. Logistic regression was performed using SASA, RMSF, and SASA (n + 1, N) as independent variables and the binary rate output as the dependent variable. All sites were assigned a value of 1 or 0 for labile and stable sites, respectively, based on a cutoff value of Asp degradation rate of 2.5%/wk at pH 5.5. Labile residues are shown in red and stable residues are shown in green. The predicted outcome was generated using the binary logistic model as described in the text. The model was validated using the LOOCV approach.

